
How Europe should answer the US Inflation Reduction Act
David Kleimann is a Visiting Fellow, Niclas Poitiers a Research Fellow, André Sapir, Simone Tagliapietra, Nicolas Véron, and Reinhilde Veugelers are Senior Fellows, and Jeromin Zettelmeyer is Director, all at Bruegel
Summary
The 2022 United States Inflation Reduction Act (IRA) is a significant and welcome climate law. It also includes trade-distortive subsidies, including local-content requirements prohibited under World Trade Organisation rules – the first time the US has done this and a blow to the international trading system that could trigger protectionism in other countries.
The expected IRA green subsidies are of similar size to those available in the European Union, except in renewable energy production, where EU subsidies remain far larger. However, there are important qualitative differences. Some IRA subsidies discriminate against foreign producers while EU subsidies do not. IRA clean-tech subsidies are simpler and less fragmented, and they focus mainly on mass deployment of green technologies rather than innovation.
The IRA will likely harm Europe through its competitiveness effect, while it will likely benefit climate transition in Europe and most of the rest of the world. However, the magnitude of both effects is very uncertain, partly because the IRA will induce substitution away from Chinese inputs.
By forcing the reorganisation of supply chains, the IRA may make the EU and other economies more competitive relative to China. It may also initially slow the green transition. But in the longer run, this effect should be outweighed by the reduction in the cost of clean tech driven by the IRA.
In responding to the IRA, the EU should not just seek to protect its competitiveness relative to the US but to pursue broader aims, including competitiveness in general, speedy decarbonisation and broad foreign policy and development policy goals.
These aims imply that the EU should not impose local-content requirements of its own, should not loosen state-aid rules and should not mimic the IRA’s approach to manufacturing subsidies.
Rather, it should focus on boosting its structural competitiveness, formulate a trade policy response that includes reform of the international subsidies regime, and develop an instrument for EU-level subsidies that focuses on early-stage development and increasing EU resilience to trade disruptions.
1 Introduction
The 2022 United States Inflation Reduction Act (IRA), a legislative package combining large-scale green subsidies with healthcare savings and new revenue measures, is a milestone in US climate policy. While less effective than combining green subsidies with carbon pricing (Roy et al 2021), the IRA is expected to close two-thirds of the greenhouse-gas emissions gap between current policy and the US 2030 climate target. By driving down the cost of developing and deploying clean energy, the IRA would also make it easier to close the remaining gap (Jenkins et al 2022).
However, the IRA contains protectionist elements. These include subsidies conditional on local-content requirements that are prohibited under World Trade Organisation rules, and large-scale manufacturing subsidies that are likely to be market- and trade-distortive.
The IRA has exacerbated European Union fears that clean-tech manufacturers and adopters will shift their production to the United States, in search of an attractive mix of subsidies and low energy costs.
This policy brief explains what is in the IRA, how it compares to EU green industrial policies, what the IRA’s impact on the EU and other economies might be, and how the EU should react. Our analysis has four main conclusions.
First, EU and expected IRA green subsidies are of about similar size, except in renewable energy production, where EU subsidies remain far larger. However, there are significant qualitative differences.
Some IRA subsidies discriminate against foreign producers while EU subsidies do not. IRA clean tech subsidies are simpler and less fragmented. The also focuses mainly on mass deployment of green technologies, whereas EU-level support tends to be more focused on innovation and new technologies.
Second, the IRA will likely harm Europe through its competitiveness effect, while it will likely benefit climate transition in Europe and most of the rest of the world. This said, the magnitude of both effects is very uncertain.
Some IRA local content requirements could be circumvented. Demand for clean-tech products in Europe and elsewhere could rise both in the face of US capacity constraints and because the IRA induces substitution away from Chinese inputs.
By forcing the reorganisation of supply chains and diverting resources to the US, the IRA, may initially slow the green transition outside the US. But in the longer run, the reduction in the cost of clean tech induced by the IRA should outweigh these costs.
Third, to our knowledge, the IRA marks the first time that the US has enacted WTO-inconsistent local-content requirements. This is a further blow to the international trading system, both as a signal that the system’s historically most powerful sponsor no longer cares, and because it may trigger protectionist responses in other countries, rendering international trade in green technology more fragmented and less efficient, and hence less effective in supporting the net zero transition.
Fourth, in responding to the IRA, the EU should not just seek to protect its competitiveness relative to the US but should pursue broader aims, including competitiveness in general, speedy decarbonisation and broad foreign policy and development policy goals.
These aims imply that the EU should not impose local-content requirements of its own, should not loosen state-aid rules and should not mimic the IRA’s approach to manufacturing subsidies.
Rather, it should focus on boosting its structural competitiveness and accelerating its green transition, through better regulation, green procurement rules, faster roll-out of renewables to reduce electricity costs, green and digital skills, and banking and capital markets union.
In addition, it should seek both WTO remedies against the IRA subsidies and reform of the international subsidies regime. Finally, it should develop an instrument for EU-level subsidies that support early-stage development and deployment of green technology in areas of EU comparative advantage, and that would make the EU more resilient to trade disruptions.
The Inflation Reduction Act has exacerbated EU fears that clean-tech companies will shift their production to the United States
2 Unpacking the Inflation Reduction Act
2.1 What’s in it?
The IRA consists of three sets of measures: a tax reform, a healthcare reform, and energy and climate legislation, including climate-related spending in the order of $400 billion over 10 years1.
The measures most relevant to the IRA’s international impact are energy and climate subsidies2. These fall into three categories, and some subsidies can be cumulated3:
1. Subsidies for vehicle purchases, including a $7,500 consumer tax credit for electric cars and a tax credit for companies, including leasing companies, that buy clean vehicles.
2. Production and investment subsidies for manufacturers of clean-tech products, including batteries and components used in renewable electricity generation.
3. Subsidies for producers of carbon-neutral electricity, as well as hydrogen and other ‘clean’ fuels (Box 1).
Box 1. The IRA’s green subsidies
Electric vehicles
The IRA introduces a $7,500 tax credit for every consumer purchase of an electric car that complies with several conditions, including local content requirements and conditions that are meant to ensure that the tax credit does not mainly benefit the rich (IRA Title 26 USC §30D)4. The IRA also includes a subsidy for ‘clean’ commercial vehicles which provides tax credits for up to 30 percent of the cost of an electric (or fuel cell) vehicle which is not subject to LCRs (26 USC §45W).
Clean-tech production and investment
These include production subsidies for batteries, wind turbine parts and solar technology components, as well as for critical materials like aluminium, cobalt and graphite (26 USC §45X). Manufacturers of these products receive a dollar amount of tax credits per unit (or energy unit) of the respective product (Annex II). Producers of eligible critical materials would receive 10 percent of their production cost as tax credits. A mid-sized 75kWh battery for an EV would receive $3,375 in subsidies, equivalent to roughly 30 percent of its 2022 price5.
Producers can also qualify for allocation of investment subsidies of 30 percent in tax credits when their investment is selected as part of an ‘qualifying advanced energy project’ programme6. However, a facility that received investment subsidies is excluded from the production tax credit described above (26 USC §45X (c)(1)(B)).
Electricity, hydrogen and clean fuels
Producers of carbon neutral electricity are eligible for a $0.015/kWh production subsidy, which can be higher under certain conditions7. Alternatively, electricity producers can benefit from investment tax credits of up 30 percent of the investment value8. These incentives are complemented by support for rural and residential green electricity production, as well as support for nuclear energy production. The production of hydrogen and clean fuels (such as renewable natural gas) is also eligible for subsidies9.
Several, but not all, of these subsidies are conditional on content produced in the US and/or North America (local-content requirements, LCRs):
-The $7,500 consumer tax credit applies only to electric cars with ‘final assembly’ in North America (the US, Canada or Mexico). In addition, half of the tax credit is linked to the origin of batteries and the other half to that of raw materials used in the electric cars. To obtain either half, a minimum share of the value of battery components (presently 50 percent) or critical minerals (presently 40 percent) needs to come from the US or countries with which the US has a free trade agreement (presently 20 countries10). These thresholds will increase by about 10 percentage points per year. In addition, from 2024 and 2025, any use of batteries and critical minerals from China, Russia, Iran and North Korea will make a vehicle ineligible for the tax credit.
-Renewable energy producers are eligible for a ‘bonus’ subsidy linked to LCRs. If the steel and iron used in an energy production facility is 100% US-produced and manufactured products meet a minimum local-content share, the subsidy increases by 10 percent, with the required local-content share rising over time11. A similar bonus scheme conditional on local-content shares applies to investment subsidies for energy producers.
There are no LCRs for subsidies for commercial electric vehicles, used electric vehicles or clean-tech production and investment (other than that these need to take place in the US).
Figure 1 shows total values of IRA subsidies broken down into subsidies targeting consumption, production or investment, and indicating whether subsidies are likely to be trade distortive (throughout this section, for IRA subsidy values, we use US Congressional Budget Office estimates; CBO, 2022).
Trade-distortive subsidies include subsidies with LCRs (or bonuses) and subsidies that do not contain LCRs but are ‘actionable’ under WTO rules (see Annex I). Trade distortive subsidies include the consumer electric car tax credit conditional on LCRs ($7.5 billion), most spending on clean-tech manufacturing support ($32 billion of the total $37 billion), the bulk of the clean-fuel and emissions-reduction subsidies ($16 billion), and the share of subsidies for green-energy production and investment expected to include local content bonuses.
The latter could be anywhere between zero (if no producer meets the qualification criteria for the local content bonus) and $21.9 billion (if all producers meet the qualification criteria)12.
These estimates need to be treated cautiously, as most measures are not capped in overall volume or value terms, and hence depend on uptake assumptions. If the uptake of uncapped subsidies – such as the clean-tech manufacturing tax credit – is higher than expected, the subsidy volumes could be much higher than current estimates13.
Figure 1. Breakdown of IRA subsidies

Note: The shaded area signifies spending on provisions that are trade distortive. This includes prohibited local content requirements for the consumer electric vehicle tax credit, the domestic content bonus in the green energy production subsidies, and production subsidies for clean-tech manufacturing and clean fuel that are actionable under WTO rules. For the domestic content bonus, the shaded area represents how much would be spent on domestic content bonuses if all relevant projects qualified for them.
Source: Bruegel based on CBO (2022).
2.2 Comparing IRA and EU green subsidies
While the EU has no flagship green subsidy scheme comparable to the IRA, it has a multitude of initiatives at EU and national levels that use subsidies for broadly similar purposes (see Annex III for details):
-Almost every EU country subsidises the purchase of electric vehicles. While incentives differ widely in form and value, these subsidies added up to almost €6 billion and averaged around €6,000 per vehicle in 2022. Unlike IRA tax credits, they typically do not discriminate between different producers.
-Clean-tech manufacturing is supported through a variety of instruments. These include:
EU Important Projects of Common European Interest (IPCEIs), crossborder projects that include support for battery and hydrogen manufacturing,
The EU Innovation Fund, established under the EU emissions trading system (ETS), that supports the demonstration and early deployment of clean technologies and processes in energy-intensive industries,
The European Innovation Council’s EIC Accelerator, which aims at scaling-up breakthrough technologies,
European Investment Bank (EIB) loans to clean technology projects,
EU guarantees under the InvestEU programme, most of which are administered by the EIB.
-Most EU member states subsidise energy production from renewables. These subsidies amounted to about €80 billion (0.57 percent of EU GDP) in 2020, with Germany leading the ranking (€33 billion, or 0.94 percent of German GDP).
Table 1 compares the three main categories of IRA green subsidies with EU subsidies that serve broadly similar purposes. The comparison is fraught with difficulties.
First, estimates for EU clean-tech manufacturing support and renewable energy subsidies are based on approved aid volumes and on the extrapolation of recent aid, while the IRA estimates are based on the take-up assumptions in CBO (2022).
Second, support items are missing on both the EU and the US sides. Estimates for clean-tech manufacturing support exclude national-level state aid (except for the IPCEIs). IRA figures obviously exclude state- and local-level support, and federal programmes outside the IRA. Given these uncertainties, the numbers in the table should be interpreted as illustrative.
Table 1. Illustrative projected US and EU green subsidy levels, 2022-2031

Note. For comparability reasons, the table focuses on aid (grant, grant-equivalents and tax credits); EIB loans are excluded. For the EU, the category ‘clean-tech manufacturing’ refers only to non-EIB EU-level programmes, ie. state aid is excluded, except for the IPCEIs. EU figures are based on the extrapolation of recent annual figures (see table in Annex III).
Sources: Bruegel; see notes to table in Annex III, and CBO (2022).
The takeaway from the table is that IRA and EU subsidies for electric vehicle purchases and clean-tech manufacturing are of a similar size, while renewable energy subsidies would still be much higher in the EU, assuming that the EU and its members continue to subsidise at the same rate as in recent years14.
The main difference between the US and EU may therefore not be in the total expected volume of green subsidies (except on renewable energy, where the US is expected to continue to lag the EU), but rather on the qualitative side.
First, IRA subsidies discriminate against foreign producers in a way that EU subsidies do not. Second, the IRA provides its clean-tech manufacturing support in a particularly simple way – via tax credits covering 10 years – while comparable EU support is more fragmented, generally viewed as slower and more bureaucratic (see section 3), and sometimes shorter-term. Third, in the clean-tech area, the IRA focuses mostly on mass deployment of current generation technologies, whereas EU level support tends to be more focused on innovation and early-stage deployment of new technologies.
3 The global and European impact of the IRA
The IRA will have an impact beyond US borders by accelerating global decarbonisation, through direct effects on trade and investment, and by affecting the global trading system.
3.1 Acceleration of global decarbonisation
The IRA will significantly accelerate decarbonisation in the US (though not as must as it would if combined with carbon pricing). On decarbonisation in other countries, the IRA may initially have counterproductive effects by forcing the inefficient restructuring of supply chains into the US to meet IRA origin requirements, and by drawing to the US resources needed for decarbonisation elsewhere15.
However, it should overall cut the global costs of clean-tech, because IRA renewable subsidies will add to the scale of global clean-tech demand16, and because IRA subsidies for US clean-tech production will benefit the rest of the world indirectly through knowledge spillovers.
In the long run, these benefits should outweigh the costs, as supply chains and critical mineral production adapt17. In addition, the IRA will likely benefit the global politics and diplomacy of decarbonisation, as it has finally brought the US into the family of countries that are serious about emissions reductions18.
3.2 Direct trade and investment effects
The IRA could through several channels have a direct impact on trade and decisions to locate production.
Consumer tax credit for electric cars
The IRA’s $7,500 consumer tax credit on electric cars could reduce the cost of an eligible vehicle of average price by about one fifth, to the detriment of electric vehicles presently excluded from the credits19.
This could have a substantial impact on the ability of foreign automotive producers to maintain their present shares in the US market. For the EU, the consequence could be large losses of exports to the US20.
That said, electric vehicles that are leased rather than sold to consumers will benefit from subsidies for ‘clean commercial vehicles’, as electric cars purchased by leasing companies are considered commercial vehicles that are not subject to domestic content restrictions21.
Also, the LCRs for batteries and critical minerals do not apply to countries with which the US has a ‘free trade agreement.’ As this term is not defined in the legislation, it may be possible to eventually include the EU, the United Kingdom and other US allies22.
In that case, electric vehicles with batteries and critical materials from those countries could qualify for the tax credit – but only if they are assembled in North America.
Production and investment tax credits
IRA subsidies for clean-tech production and investment in the US are high relative to the current prices of these products, varying between 10 percent for critical minerals to about 26 percent for solar panels23, 24.
As the subsidies are linked to production units rather values, their impact could increase further if the prices of the goods that they subsidise continue to fall25. Investment credits are also substantial: most of these incentives are set at around 30 percent of investment, with additional bonuses for domestic content26.
But again, significant offsetting factors make the net effect hard to predict. First, the rise in global demand for clean tech resulting from IRA renewable energy subsidies could benefit producers not just in the US, but also abroad, while US capacity remains constrained. While the EU does not have a large solar-panel manufacturing industry, it does produce and export wind turbines.
Second, countries with a ‘free trade agreement’ with the US (which may in the future include the EU and other US allies) will benefit from the condition that to be eligible for tax credits, electric vehicles must exclude Chinese batteries and critical minerals. This could benefit the EU’s fledgling battery manufacturing efforts (such as the facilities supported by IPCEI Batteries27).
Third, while the IRA’s green-tech investment credits are high, EU IPCEI project funding is in about the same ballpark28.
Energy prices
Even before the COVID-19 pandemic and Russia’s invasion of Ukraine, industrial electricity prices were lower in the US than in the EU (in 2019, by about 30 percent). The war has led to a surge in European industrial electricity prices, which are now about twice as high as in the US29.
These differences might be further magnified by IRA support for green electricity production, some of which has virtually zero marginal costs. This said, green energy production subsidies do not translate directly into the prices that (industrial) consumers pay30, and the duration of the energy crisis and the domestic roll-out of clean electricity generation will be more important than IRA subsidies for the competitiveness of energy-intensive industries in Europe.
It is unclear whether IRA subsidies have already led to a diversion of investment from the EU to the US. While a number of projects have been announced since the IRA passed in mid-202231, some may have happened anyway.
Evidence on whether these projects have been implemented to the detriment of competing investments elsewhere is so far lacking. An empirical analysis of the effects of the IRA on investments in the EU will therefore have to wait until a clearer picture emerges.
Historical precedents for such a competitiveness shock point in different directions. Fracking in the mid-2000s turned the US from an oil and gas importer into an exporter and led to fears over the competitiveness of European manufacturing.
However, while the shale revolution has led to a global fall in energy prices, the feared migration of energy-intensive industries did not materialise.
The accession of China to the WTO provides another example. Advanced economies benefitted from specialisation in high value-added industries and from cheap inputs and consumer goods from China.
However, the distribution of costs and benefits was uneven, and regions specialised in goods in which China proved competitive suffered (see Autor et al 2021).
3.3 Impact on the multilateral trading system
The use of both actionable and prohibited subsidies (Annex I) puts the IRA clearly at odds with multilateral trade rules that the US helped shape.
While the adoption of WTO-inconsistent policies is hardly rare or even new32, the incremental effect of the IRA in undermining the multilateral trading system could be very serious, for three reasons.
First, the IRA adds to a number of blatant and broadly applicable WTO-inconsistent policies advanced by the Trump administration, and continued (and more recently, also justified) by the Biden administration. These include US Section 232 tariffs on steel and aluminium imports and US Section 301 tariffs against a wide range of imports from China.
The IRA thus contributes to the international perception that the Biden administration is keeping on the disruptive trade policy path chartered by President Donald Trump.
Second, the US has never before, to our knowledge, made WTO-prohibited subsidies contingent on local-content requirements. This could send a powerful signal that such LCRs can be applied even in advanced countries.
For example, French President Emmanuel Macron has publicly called for reciprocal EU requirements: “We need a Buy European Act like the Americans, we need to reserve [our subsidies] for our European manufacturers”33. Broad adoption of sourcing restrictions would render international trade more fragmented, less efficient and hence less effective in supporting the net zero transition.
Third, the increasing disregard for WTO rules by the system’s historically most powerful sponsor comes at a moment when the WTO is already weak. The US continues to block the operation of the WTO Appellate Body, and negotiations over WTO institutional reform (as de facto chaired by the United States) have so far not resulted in any discernible progress.
An ineffective WTO is bad news for global trade and prosperity, particularly for developing countries for which trade has been, and should continue to be, a powerful source of growth and technological catch-up.
4. How Europe should respond to the IRA
The EU’s objectives in responding to the IRA should be informed by its external competitiveness, but also by the need to maintain a level playing field inside the EU, speedy decarbonisation both in the EU and the rest of the world, and broader foreign policy and development policy goals. The latter include relationships with countries that have not aligned themselves with either China (let alone Russia) or the West.
4.1 What not to do
This broad definition of EU objectives has some immediate implications, notably, by helping to identify what the EU should not do in reaction to the IRA:
Local-content requirements. The EU should not reciprocate the IRA’s local-content requirements. While LCRs might help with EU competitiveness in the short run, by redirecting demand to EU producers, they would hurt the EU on several other fronts: by harming the critical objectives of accelerating the global climate transition, by harming EU export
interests, as trading partners might reciprocate, and by harming the EUs credibility as a global actor committed to multilateral cooperation.
The latter is essential for EU foreign policy interests. The EU’s ability to persuade other countries to respect internationally agreed norms – and to align themselves with the EU against countries, like Russia, that violate such norms – would suffer a severe blow if the EU was viewed as applying a double standard.
Loosening of state aid rules. Loosening state aid rules would risk fragmenting the EU single market. This is demonstrated by the large increases in both the level and the cross-country dispersion of subsidies that have occurred as a result of recent crises – COVID-19 and Russia’s invasion of Ukraine – which have led to special legal regimes allowing the approval of subsidies that would otherwise have breached the rules (Box 2).
Box 2. The impact of the COVID-19 state aid temporary framework on EU subsidies
The Treaty on the Functioning of the European Union (TFEU) prohibits provision of state aid by member states to companies, but provides for exceptions, including “to facilitate the development of certain economic activities or of certain economic areas, where such aid does not adversely affect trading conditions to an extent contrary to the common interest” (Article 107(3)).
To invoke this exception, EU countries must show “that any detriment arising from distortions of competition is outweighed by the positive effects of the aid” (European Commission 2022a). The latter typically requires demonstrating that state aid does not only benefit the recipient firm but reduces market failures (such as externalities).
An additional exception to the prohibition of state aid is provided for “aid to remedy a serious disturbance in the economy of a member state” (Article 107(3)(b)). How far the remedy can go and what constitutes a serious disturbance can be regulated through guidelines and frameworks adopted by the European Commission and secondary legislation proposed by the European Commission and adopted by the Council of the EU.
Hence, although the exception itself is hard-wired into the Treaty, EU policymakers have considerable control over how to handle the exception.
In March 2020, the EU adopted a temporary framework based on Article 107(3)(b) to regulate state aid in response to the COVID-19 pandemic, undoubtedly a serious disturbance.
This framework has since then been amended and extended several times, most recently in response to the Russian invasion of Ukraine and the ensuing disruptions to energy markets. EU policymakers are debating whether to extend the framework further to allow more state aid in response to the US Inflation Reduction Act.
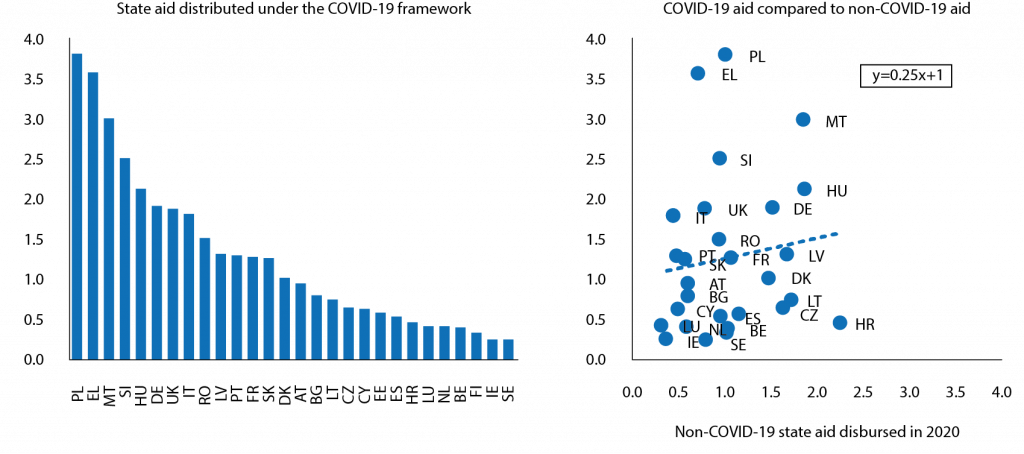
Figure 2: State aid disbursed in 2020 (aid content, % of GDP)
Source: European Commission.
Figure 2 shows the impact of this temporary crisis framework on the level and distribution of state aid disbursed in 202034. The data in the figure refers to the ‘aid content’ (ie grants or grant-equivalent guarantees or lending subsidies) of actual aid disbursements (data for aid approved and/or based on nominal volumes would show much larger volumes).
The left panel of Figure 2 shows the distribution of aid disbursed under the COVID-19 temporary framework. The right panel compares this to the aid disbursed under standard, non-COVID-19 rules. Two insights are worth highlighting.
First, the dispersion of state aid disbursed under the COVID-19 temporary framework has been much higher than that of non-COVID-19 (standard) state aid. Disbursements of non-COVID-19 state aid ranged from 0.4 percent of GDP (Italy) to 2.3 percent of GDP; the standard deviation was 0.53 percent of GDP.
For COVID-19 state aid, the smallest disbursements (Ireland and Sweden) were 0.23 percent of GDP, and the largest (Poland) was 3.8 percent of GDP. The standard deviation was 1 percent of GDP. Importantly, this higher dispersion cannot be explained by differences in the magnitude of the COVID-19-related economic shock35.
Second, the dispersion of COVID-19-related aid does not offset the dispersion of non-COVID-19 aid; if anything, it magnifies it. This is shown in the right panel, which shows that COVID-19 and non-COVID-19 aid was positively correlated (although the correlation is not statistically significantly different from zero).
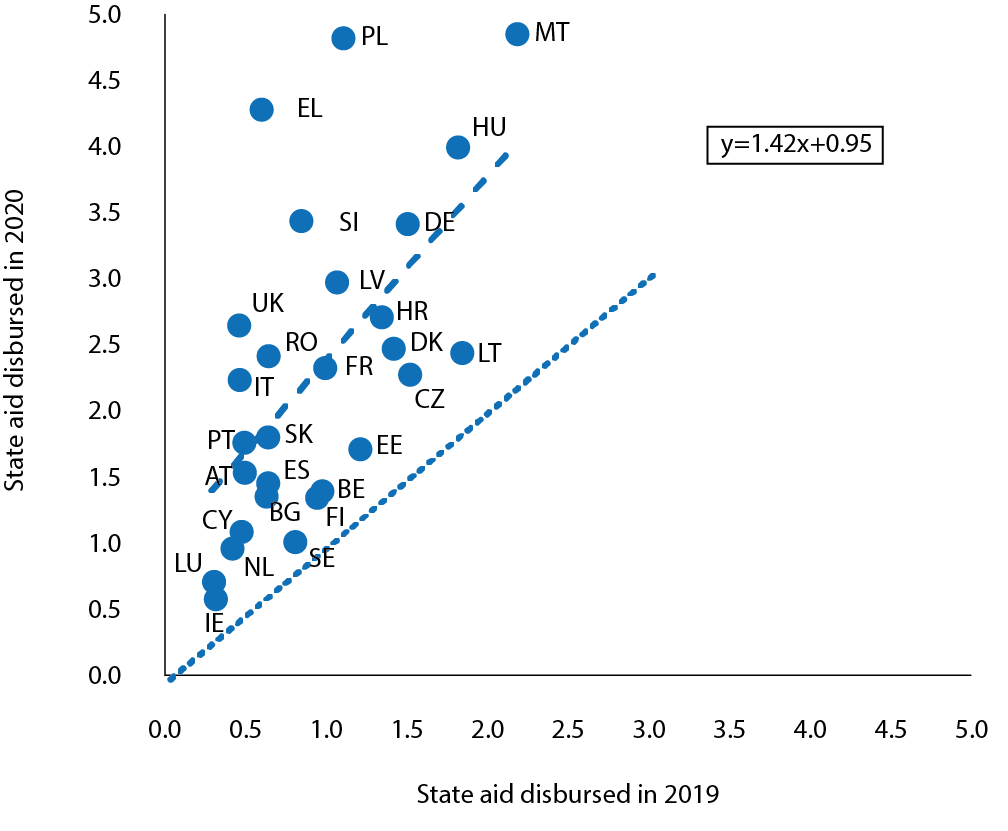
To get a sense of the overall impact of COVID-19 aid on aid disbursed, Figure 3 compares total aid disbursed in 2020 with total aid disbursed in 2019. It illustrates, first, the upward shift in aid: all observations are above the 45-degree line.
Second, aid in 2020 was much more dispersed than aid in 2019, with total disbursements ranging from 0.5 percent to about 5 percent of GDP, compared to 0.3 percent to about 2 percent of GDP in 2019.
Third, and perhaps most disturbingly, the trend line is steeper than the 45-degree line (slope coefficient of 1.4). This implies that COVID-19 aid tended to further increase the distance between those that were already subsidising a lot in 2019 and those that were subsidising less.
Figure 3. Total state aid disbursed in 2020 compared to total aid disbursed in 2019 (aid content, % of GDP)
Source: European Commission.
Extending these temporary crisis frameworks in response to the IRA would also likely constitute an abuse of the legal basis underpinning these temporary frameworks, namely Article 107(3)(b) of the Treaty on the Functioning of the European Union.
Even in the darkest interpretation of its effects, the impact of the IRA does not amount to a “serious disturbance to the economy of a member state” anywhere near the magnitude of previous economic shocks that have justified this use of the Article, such as the global financial crisis, the pandemic and the energy price shock following Russia’s invasion of Ukraine36.
It is also worth recalling that green subsidies, justified by environmental externalities and the fight against climate change, can already be approved under the existing EU legal framework, particularly since the 2022 Guidelines on State aid for climate, environmental protection and energy (European Commission, 2022b). Subsidies related to decarbonisation do not require a new or extended crisis framework.
Emulation of the IRA´s manufacturing subsidies. The EU should not seek to emulate the IRA’s clean manufacturing subsidies, even at the EU level, for two reasons. First, the EU does not in fact lag the IRA in terms of the volume of such subsidies (section 2 and Annex III), only in terms of their simplicity, EU-level consistency and predictability. Second, the IRA mostly subsidises green production that does not match the EU’s comparative advantage.
Meanwhile, a strong case can be made for making EU-level and national subsidies that are compatible with EU state aid rules simpler and more predictable, like IRA subsidies.
4.2 What the EU should do
It is easy to say what the EU should not do in response to the IRA, but harder to say what it should do. An EU response can be explored under three main headings: (1) structural competitiveness improvements, (2) EU-level subsidies for green innovation, and (3) trade policy.
Some of our recommendations involve new policy actions: reform of electricity market design, the set-up of a new European fund for quick expansion of renewable energy capacity, the launch of an EU strategy for clean-tech skills and the adoption of a new strategy for green innovation at the EU level.
Other recommendations focus on the removal of obstacles or increased efforts in policy areas that have been long debated. This is the case, for instance, of the further development of single-market regulations favouring clean technology, the increased use of green public procurement and further development of the banking and capital markets union.
Structural improvements in competitiveness
The EU does not just need to become more competitive relative to the US, it should become more competitive generally. In this respect, the single market is the EU’s most important tool, including for providing incentives for private clean-tech investment.
Single market rules can accelerate the roll-out of clean technologies by avoiding regulatory costs associated with fragmentation, uncertainty and bureaucracy. An efficient electricity market design can help to lower energy costs structurally, also for clean-tech manufacturers, with the related competitiveness benefits.
A strategy to develop green skills will help avoid labour shortages and raise productivity in Europe’s clean-tech sector. Banking and capital markets union can overcome Europe’s highly bank-dominated and fragmented financial system and mobilise private capital for clean tech. In the following, we review these items and outline some proposed policies.
Single market regulations favouring clean technology
The EU has several non-subsidy mechanisms at its disposal to support the development and roll-out of clean-tech manufacturing (European Commission, 2023).
These include regulations aimed at setting time limits for each stage of permitting procedures, a measure that can accelerate developments in areas vital to decarbonisation thus enlarging more quickly markets for clean-tech.
For example, in December 2022 EU countries agreed a temporary emergency regulation to fast-track permits for renewable energy infrastructure and grids (Council Regulation (EU) 2022/2577). Similarly, tighter European standards can foster global competitiveness by demonstrating marketability and attracting investment in firms that comply with standards.
One example, agreed by the EU in December 2022, is the introduction of stronger environmental sustainability requirements for all batteries sold in the EU37. Another option could be to develop regulatory sandboxes to allow for quicker development of clean technologies and fast-tracking of the necessary certifications required for placing them in the market38.
Green public procurement
Public procurement accounts for about 14 percent of EU GDP. The EU should use it more strategically to push European industry to develop green technologies and products through the creation of lead markets and demonstration effects, leading to a spillover effect that will increase demand for greener goods and services.
In particular, greater use of green public procurement would be important in sectors in which public purchasers make up a large share of the market, including transport and construction (Rodriguez Quintero et al 2019). In such cases, the purchasing decisions of public authorities can encourage green innovation by giving start-ups access to economies of scale (Mazzucato, 2013).
Green procurement can also have an impact on competitiveness. By introducing sustainability requirements for clean technologies (for instance, by rewarding in tenders the use of electric cars that are produced following certain sustainability criteria, or based on certain innovation or environmental features), the EU could prioritise the deployment of clean technologies produced to European standards, without having any form of local content requirement39.
Lowering the cost of electricity through sound market design
The best remedy to deal with high electricity prices driven by high gas prices is to accelerate the deployment of renewables. Expanding renewable energy sources will help reach Europe’s decarbonisation targets and will also reduce energy costs for EU electricity consumers, reducing incentives to relocate to the US.
One way to stimulate renewables investment is to create markets for long-term contracts to sell electricity produced by renewables, either between private entities through pre-purchase agreements and forward contracts, or between the state and generators through contracts for difference (Glachant, 2023; Schlecht et al 2022)40.
Such contracts could reduce the cost of capital for renewable investments – by guaranteeing a fixed, stable income – and reduce costs for electricity consumers, by being priced at a level close to the average cost of supplying electricity, rather than the potentially very high marginal cost.
A more direct measure to expand renewable capacity could be to set up a European fund that guarantees a feed-in premium for newly connected wind and solar plants, in addition to the other regular cash flows41. The fund could guarantee a premium for 10 years for the first gigawatt produced under the scheme, and a lower premium for any additional gigawatt.
As a first-come first-served scheme, this could encourage the accelerated deployment of renewables needed to lower European industrial energy costs in the medium-term and to drive power-system decarbonisation.
A complementary measure would be to simplify, accelerate and harmonise the regulatory process for infrastructure projects connecting the electricity grid, particularly for crossborder connecting infrastructure.
Skills
The speed of manufacturing and roll-out of clean technologies is correlated closely with the simultaneous development of a qualified workforce to implement clean projects. Ensuring a sufficient capacity of skilled workers is of prime importance for Europe, both to avoid shortages and to ensure a high level of productivity for its clean-tech industry.
This also is a crucial item when it comes to the just transition, as part of the workforce currently employed in carbon-intensive sectors can be re-skilled and re-employed in green-energy projects (IEA, 2022).
Recognising these factors, the EU has put forward a European Skills Agenda (European Commission, 2020) to help individuals and businesses develop more and better skills in these sectors. It has earmarked sizeable funds to support worker training: the €61.5 billion European Social Fund Plus (ESF+), and also the Just Transition Fund (JTF) and the Recovery & Resilience Facility (RFF).
The European Commission (2023) has stressed that the EU and its members can do more. For instance, as Europe seeks to develop pan-European clean-tech supply chains, it would be efficient to have integrated continuous monitoring at EU level of the status of supply and demand in green skills and jobs.
The EU single market for clean skills could be promoted by developing a Europe-wide strategy for clean-tech higher qualifications, and by easing intra-EU mobility of talent, linked also to Erasmus+ funding. Sector-level efforts should also be made through links to European industrial alliances.
The establishment in February 2023 of a large-scale skills partnership for onshore renewable energy under the Pact for Skills42 is a welcome first step in this direction.
Banking and capital markets union
The cost of accessing finance is an important factor in firms’ clean-tech investments. The EU financial system is highly bank-dominated and fragmented along national lines, which makes it ill-suited to enabling the massive investments needed for the green transition through the provision of private capital.
Major policy initiatives have been undertaken to that effect, particularly since 2012 (banking union) and 2014 (capital markets union), but they remain unfinished and have largely stalled in recent years. They must be revived as part of a comprehensive EU response to the IRA.
Banking union and capital markets union are twin projects. The aim is to move decisively from a fragmented collection of national financial systems to a single European financial system that can finance projects on a European scale.
Since European finance is overwhelmingly bank-based, a structural feature that cannot be changed in the short or medium term, banking union is the key to financial-system integration, and it is illusory to think of a capital markets union without completing the banking union at the same time.
Completing the banking union is necessary but not sufficient, and a properly defined set of actions on capital markets union must complement it (Véron, 2014).
Completing the banking union is best defined as breaking the vicious circle between banks and sovereigns and improving the EU’s governance framework for resolving banks and managing banking crises (Beck et al 2022).
Steps already taken, mostly the integration of euro-area banking supervision centred on the European Central Bank, have not been sufficient to achieve this. Negotiations during the last seven years ended in stalemate at a June 2022 Eurogroup meeting43.
The sequence illustrates the political difficulty of completing the banking union, linked to thorny issues of crossborder risk-sharing through deposit insurance, reform of some aspects of banks’ business models through the introduction of general depositor preference, and strengthening of market discipline for sovereign debt issuance through regulatory curbs on banks’ concentrated domestic sovereign exposures.
Many entrenched interests resist reform, both in the banking sector and among the public authorities that oversee it. Still, completing the banking union would arguably be less politically challenging than what was achieved in 2012, with the decision to replace national bank supervisory frameworks with European banking supervision.
As for capital markets union, some of the initiatives undertaken since 2014 (the latest announced in December 202244) are significant, including steps towards a European Single Access Point for corporate disclosures and a post-trade consolidated tape, or single dataset of prices and volumes for securities traded in the EU, both proposed in November 2021.
Nevertheless, much more should be done to defragment Europe’s capital markets, starting with the supervisory architecture. Major decisions should be centralised in a reformed European Securities and Markets Authority, with a changed governance and funding framework to make it more effective and more independent.
Reform should streamline the jumble of market infrastructures, asset management and auditing frameworks that currently prevent an efficient pan-European allocation of European savings to European projects, including those needed for the green transition.
Given their complexity and political sensitivity, these objectives for banking union and capital markets union cannot be met in the current EU legislative term. But they should be high on the list of priorities for the next EU leadership after the 2024 European Parliament elections.
EU-level subsidies for green innovation
While the EU should not copy the IRA’s production subsidies, there is probably a case for more EU subsidies for green R&D, innovation and early-stage deployment of next-generation green technologies, in which EU companies could build and maintain globally competitive positions.
Likewise, there is likely a case for building or maintaining within the EU minimum levels of capacity in certain critical areas for the green transition, to make the EU more resilient to natural or political shocks.
The EU needs to design such subsidies without harming the single market’s level playing field. This calls for an EU-level approach to early-stage, high-risk projects. This should deliver far more in terms of synergies, integration of knowledge spillovers and cost and risk sharing, than an approach based on national subsidies.
The EU’s current approach, based on the crossborder coordination of national projects through IPCEIs, or projects envisaged by the European Chips Act45, may not be optimal. Current schemes are bureaucratically heavy and end up mostly supporting a few large incumbent firms that have the ability and experience to propose and manage such projects, which typically take place in the EU countries that have sufficiently deep pockets to support them (Weil and Poitiers, 2022a; 2022b).
While large firms can play an anchor role in such projects, it is important to ensure that smaller players and radically new clean ecosystems can find their place.
Otherwise, the risk is that the IPCEI format will fail to pick ‘winning’ clean ecosystems, particularly disruptive new green technology solutions, most likely proposed by new young firms.
EU funding should also seek to improve EU strategic resilience. This involves support for new technological solutions for critical components that may make EU clean-tech production vulnerable to supply chain disruption (eg. by funding mission-oriented programmes to develop substitutes for certain critical raw materials today key in green value chains).
For these new early-stage projects, the EU approach should rely on a different instrument to IPCEIs. New support models that provide grants in a relatively non-bureaucratic way are crucial to unleash high risk/high return ideas46. Funding such grants could be the main purpose of the EU Sovereignty Fund proposed by the European Commission (2023).
New joint borrowing may not be needed to fund such EU initiatives. As suggested by the European Commission (2023), one option could be to re-shuffle EU budget money. Another option could be to make use of the additional €20 billion in grants that will be devoted to the new REPowerEU facility under the EU Recovery and Resilience Facility, and blend some of this money with EIB loans and guarantees47, 48.
Public funding can be more efficient when leveraging private investments in clean-tech public-private partnerships, with the size of the multiplier depending on the framework conditions that shape the private incentives for clean-tech investment.
To this end, a green EU subsidy policy should be accompanied by monitoring of the barriers private firms face when investing in clean tech. These barriers can include lack of access to finance, excessive regulatory burdens, lack of access to public (procurement) and private markets, and lack of access to critical skills and components.
Unless these barriers are addressed, additional public funding may not be as efficient. A further complementary policy instrument is carbon pricing. The ETS remains the critical cornerstone of any net zero industry strategy.
WTO rules would not prohibit subsidies of this type. In addition, because the main purpose of such funding would be to strengthen EU resilience and promote early-stage development and adoption, it would be less likely to distort international trade than IRA production subsidies, and hence less likely to attract WTO challenges.
Trade policy
How should the EU respond to the prohibited LCRs and actionable production subsidies (see Annex I) featured in the IRA in view of the near impossibility of a legislative amendment of the IRA in the current Congress?
Bilateral EU-US negotiations have been taking place within the framework of a dedicated ‘IRA Taskforce’ since October 2022, focusing on the IRA implementing regulations, which were due to be adopted by the US administration before the end of 2022.
This deadline was extended to March 2023, which has been widely interpreted as an effort to accommodate some of the concerns of US trading partners. The IRA regulatory process and the guidelines to be issued by US administration are particularly relevant for the electric vehicle tax credit and associated LCRs for battery and critical mineral components. If exempted, the EU’s most pressing commercial and legal concerns about the IRA would reduce substantially.
However, EU intermediate inputs would still be subject to the requirement that final assembly into finished products take place in North America, and domestic production subsidies, such as the clean manufacturing tax credit, will likely be unaffected by the US regulatory process.
If the guidelines issued in March 2023 do not sufficiently address the EU’s legitimate commercial interests, it will need to assess its trade policy options.
The EU could immediately initiate a WTO dispute targeting the LCRs attached to the electric vehicle and clean-energy tax credits. Pursuing this option would send an unambiguous political signal that the EU continues to invest in the WTO’s rules-based system, values the balance of concessions codified in the WTO agreements, holds the US accountable for breaches of obligations, and seeks leverage for prospective bilateral negotiations with the US Trade Representative (USTR).
Given the obvious breach of WTO rules that prohibit LCRs, the findings of a WTO panel could reasonably be expected within a year. If and once IRA production subsidies evidently harm EU interests, a WTO legal complaint could also target these elements of the legislation.
USTR may appeal the panel report, in which case it would remain unadopted, as the WTO Appellate Body is not operational. However, the EU could retaliate against the in-breach IRA measures under the reformed EU Trade Enforcement Regulation (Regulation (EU) 2021/167).
The European Commission could also launch a countervailing duty investigation to determine whether the US has granted a specific subsidy to a US firm or sector, and if such a subsidy causes or threatens to cause injury to EU industries.
In case of a positive finding, the Commission would propose to the EU countries duties to countervail the US subsidy. However, this remedy is only available if foreign subsidies directly and negatively affect the economic situation of the domestic industry and is limited, in its application, to subsidised exports.
A more desirable but more challenging option would be to start negotiations on a plurilateral or multilateral agreement on permissible environmental subsidies (Kleimann, 2023; Clausing and Wolfram, 2023).
This would be a response not just to the IRA, but to the problem that the design and scale of desirable environmental subsidies is on a collision course with existing international subsidy rules and national trade remedy (ie. anti-foreign-subsidy) regulations, and risks provoking an international subsidy war.
The challenge will be to define, negotiate and agree on permissible environmental subsidy practices that maximise environmental impacts while minimising trade distortions. Various forums could host the technical and political negotiations necessary to generate an enabling and permissible environment for appropriate net global welfare enhancing subsidies49. The EU should provide much needed leadership by initiating this process.
In principle, several of the listed options – and in particular litigation through the WTO and bilateral or plurilateral negotiations – could be pursued at the same time. Negotiations might be catalysed and accelerated by an EU legal complaint at the WTO that is credibly looming or proceeds in parallel with these negotiations.
5 Conclusion
The US Inflation Reduction Act is a game changer in several respects.
First, by helping the United States – the second largest CO2 emitter in the world behind China – meet its 2030 climate target, the IRA will contribute significantly to global efforts to reduce carbon emissions. This positive effect will result both from lower emissions in the US and most likely also from lower emissions in other countries, thanks to reduced costs for green technologies.
Second, the economic effect of IRA could also be substantial for the EU, but whether the effect will be good or bad is uncertain. This is because IRA measures consist mainly of subsidies, some of which are distortionary to the point of even being partly reserved to producers located in North America, in violation of WTO rules that outlaw subsidies conditional on local content.
That the IRA consists mainly of subsidies should not be a problem for EU producers, provided the subsidies are non-discriminatory. EU firms should in principle be well placed to benefit from higher demand for green-tech products generated by IRA subsidies.
However, even if IRA production subsidies were completely non-discriminatory, they would nonetheless improve the attractiveness of the United States compared to other locations, including the EU. This is what is prompting calls for the EU to respond to IRA subsidies with more permissive state-aid rules, a measure which if implemented could jeopardise the EU single market.
The best way for the EU to respond is instead to improve the attractiveness of the EU single market as a location for green investment, with horizontal measures that improve the single market’s functioning in key areas (including energy, finance and skills), as well as specific measures in favour of clean technology.
These include better regulation, green procurement rules and EU-level financing supporting new or early-stage clean-tech areas in which EU firms have the potential for sustainable competitive positions. EU funding should also seek to improve EU strategic resilience.
Furthermore, the EU should be mindful of – and react to – IRA subsidies that are distortionary and threaten to displace green-tech production of certain goods and services from the EU to the US.
In particular, the EU should not tolerate the use of LCR subsidies by the US (or any other trading partner) since they blatantly violate WTO rules. The best way to deal with this situation is to continue negotiating with the US administration to obtain an exemption from IRA LCRs, and possibly to launch WTO proceedings to obtain redress.
Finally, the IRA sets a worrying precedent for the global trading system. For the first time, the US has put in place LCR subsidies, in clear violation of WTO rules. This comes in addition to the US’s disregard for certain WTO rules and, more broadly, the refusal of major countries to stick to international trade norms.
It is happening when the international community badly needs greater cooperation to tackle perhaps its biggest-ever challenge, climate change. Rather than seeking to maximise their competitive positions through beggar-thy-neighbour climate policies, the largest CO2 emitters (China, the US, the EU and India, which together account for 60 percent of current emissions) should agree on rules that maximise the impact of their climate policies.
Senior US policymakers often refer to the rules-based international order as if American adherence to it was a self-evident fact (eg. Sherman, 2023). It is not. The EU cannot force the US to correct course but it must demonstrate that adherence to international rules during the green transition is possible, and not a losing position.
Annex I: IRA subsidies in the context of WTO law
Prohibited subsidies
The WTO Agreement on Subsidies and Countervailing Measures (ASCM) prohibits subsidies outright if they are made contingent on the use of domestic over imported goods. The agreement thus gives justice to the notion that subsidies subject to local content requirements are a priori considered to be trade distortive. In WTO dispute-settlement proceedings, a finding of a prohibited subsidy will result in an obligation to immediately remove the subsidy, and the authorisation of countermeasures if the measure is not removed within a reasonable time (Article 4 ASCM). Subsidies contingent on the use of local content would also violate the General Agreement on Tariffs and Trade’s (GATT) national treatment provision (GATT Article III:4). The outright prohibition of local content requirements renders this category of subsidies particularly vulnerable to WTO legal challenges and makes litigation speedy and straightforward.
The following IRA subsidies contain prohibited local content requirements and are therefore vulnerable to a WTO legal challenge advanced by the EU or other WTO members:
(1) extension and modification of credit for electricity from certain renewable resources; (2) extension and modification of the energy tax credit; (3) clean vehicle tax credit; (4) clean electricity production credit; and (5) clean electricity investment credit.
Actionable subsidies
The GATT exempts from its national treatment provisions the payment of subsidies exclusively to domestic producers. In other words, domestic production subsidies are generally permissible (Article 3:8(b) GATT). They are, however, ‘actionable’ under the ASCM if they confer a benefit and are made to a specific industry, as opposed to all economic operators. Actionable subsidies are only inconsistent with the ASCM if it can be demonstrated that they distort international trade generally, or in relation to the complaining WTO member specifically (Articles 5, 6 and 7 ASCM). Other than the relatively rare use of WTO dispute-settlement procedures to challenge ‘actionable’ foreign subsidies, an industry that is on the receiving end of an actionable subsidy may be subject to countervailing duties (CVD) imposed by a third-country government. The imposition of countervailing (anti-subsidy) duties requires a government agency’s investigation in accordance with ASCM provisions, and a finding of injury to the domestic industry producing the like product, measured as effects on bilateral trade volume, price, revenue, sales, profits, productivity and capacity utilisation (Part V ASCM). Governments frequently employ countervailing duties against foreign subsidies, with a sharp increase over the past decade.
The following IRA subsidies are vulnerable to national countervailing duty investigations if the above-mentioned market effects can be demonstrated: (1) sustainable aviation fuel tax credit; (2) tax credit for production of clean hydrogen; (3) advanced manufacturing production tax credit; (4) clean fuel production tax credit.
Figure A1: Countervailing measures in force on or after 01/01/2022, by year of application

Note: Figure shows 279 items in total. 2022 data relates to January to June only.
Source: Bruegel based on WTO.
Annex II: IRA advanced manufacturing production tax credits

Source: IRA Title 26 USC §45X.
Annex III: Europe’s industrial policies for clean-tech deployment
Europe does not have a flagship clean-tech deployment scheme comparable to the IRA. Instead, it has a multitude of policy initiatives and tools at different levels (regional, national, EU), which are generally uncoordinated, if not conflicting (Table A1).
Table A1. Examples of Europe’s industrial policy tools for clean-tech deployment
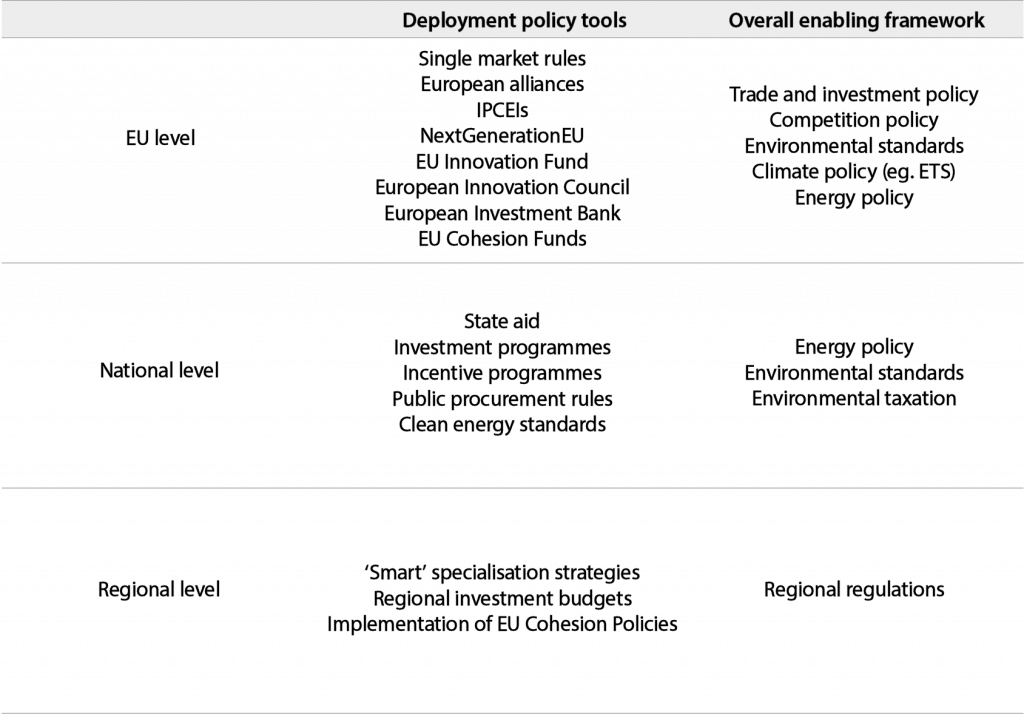
Note: as the IRA predominantly focuses on clean-tech deployment, for the sake of comparison this table only focuses on Europe’s deployment policy tools and overall enabling framework. It does not include pure research and innovation policies (eg. Horizon Europe), as those policies are not a key part of the IRA either.
Source: Bruegel.
This fragmentation makes it difficult to assess how much public support (both national and EU-level) is provided every year to clean tech manufacturing and deployment. Table A2 attempts to provide an overview for the most important spending categories. Spending on green research is not included in this exercise (or indeed the IRA).
In the remainder of this Annex, we seek to identify the EU counterparts to the three green subsidy categories of the IRA highlighted in the main text and Box 1.
Electric vehicles. Almost every EU country has been subsidising the purchase of electric vehicles. Incentives differ widely from country to country, both in form (eg. tax benefits or purchase subsidies) and value. In 2022, purchasing subsidies ranged between €10,000 in Cyprus to €1,250 in Czechia. Across the entire EU, these subsidies added up to almost €6 billion and averaged around €6,000 per vehicle. Unlike the support provided by the IRA, these EU purchasing incentives typically do not discriminate between different producers.
Table A2. Examples of annual support to green tech manufacturing and deployment in the EU
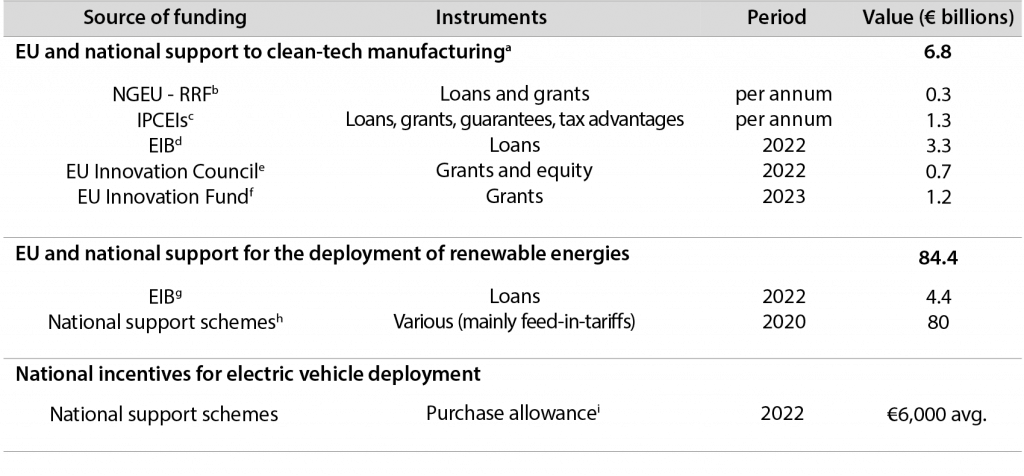
Notes: a. Support to clean manufacturing includes support to green hydrogen and batteries. b. This estimate includes the amount of loans and grants approved under the RRF for battery-related projects and divides it by the number of years of its duration (2020-2026). The large share of the funding available for projects related to hydrogen falls under the umbrella of the IPCEIs. Based on data from the Bruegel dataset on European Union countries’ recovery and resilience plans. c. The estimate for the IPCEIs includes the overall amount of public funding granted by EU countries for four IPCEIs (two batteries- and two hydrogen-related) divided by the number of years they are expected to run. Based on data provided by European Commission. d. This estimate includes the overall amount of loans granted to industries and transport for projects related to batteries, hydrogen and electric vehicles in 2022. Based on data provided by the European Investment Bank. e. This estimate considers the amounts provided in 2022 for the EIC Accelerator. It notably includes the budget for EIC Challenge (€536 million devoted to technologies for Open Strategic Autonomy and ‘Fit for 55’, as well as a third of the €630 million budget allocated to open calls – this being just a working assumption. f. This estimate considers the value of support to small- and large-scale projects awarded in the first call for projects. Appraisals for the second call for projects are still ongoing at time of writing. Based on data provided by European Commission – European Innovation Fund. g. This estimate includes the value of loan disbursed for renewable energy-related projects (ie. solar and wind) by the EIB in 2022. h. This estimate includes the amount of support offered by EU countries in the form of direct transfers, tax expenditure, FiT/FiP, RES quotas and others in 2020. Source: European Commission, Directorate-General for Energy. i This estimate is the average subsidy offered for the purchase of a new battery-electric passenger car across EU countries.
Source: Bruegel based on data provided by the European Automobile Manufacturers Association and government websites.
Support for clean tech manufacturing is channelled through several instruments and facilities.
–EU countries have access to loans and grants to support green investments under the Recovery and Resilience Facility (RRF), including for the decarbonisation of industry and strengthening clean-tech supply chains.
–IPCEIs support major crossborder innovation and infrastructure projects To date, the European Commission has approved two IPCEIs related to batteries (€3.2 billion for the period 2019-2031 and €2.9 billion for the period 2021-2028) and two related to hydrogen (€5.4 billion and €5.2 billion, respectively, for 2022-2036), partly covered by funds from the RRF50.
–The EU Innovation Fund, established under the EU emissions trading system, supports the demonstration and early deployment of clean technologies and processes in energy-intensive industries. In its first call in 2022, the Fund awarded grants amounting to around €1 billion. A hydrogen-specific pilot auction worth €800 million will take place in June 2023 (European Commission, 2023).
–Under Horizon Europe, the European Innovation Council has a deployment leg called EIC Accelerator, which aims at scaling-up breakthrough technologies, including green tech.
–The European Investment Bank (EIB) allocated around €17.5 billion in loans to the transport and industrial sectors in 2022; we estimate that approximately €3.3 billion was targeted at clean-technology projects. The EIB is also responsible for the implementation of around 75 percent of the EU guarantees allocated to the InvestEU programme.
Except for the IPCEIs, the estimates presented in Table A2 do not include state aid, the largest subsidy category (green and not) in the EU by far. The Treaty on the Functioning of the European Union prohibits state aid but allows exceptions, including for IPCEIs, “to remedy a serious disturbance in the economy of a member state”, and “to facilitate the development of certain economic activities or of certain economic areas, where such aid does not adversely affect trading conditions to an extent contrary to the common interest” (Article 107(3); see Box 1).
It is not possible to precisely identify the volume of non-IPCEI state aid for clean-tech manufacturing based on European Commission data; however, this is unlikely to be very large compared to the IPCEIs and particularly compared to renewable energy subsidies51.
Renewable energy subsidies
In 2020, the latest year for which consolidated figures are available, subsidies given by EU members to electricity production from renewable energy sources (RES) amounted to €80 billion (0.57 percent of EU GDP), with Germany leading the ranking (0.94 percent of GDP, or €33 billion). Feed-in tariffs and feed-in premiums represented 79 percent of total RES subsidies in 2020, for a total of €63 billion.
In terms of technology, solar energy received the largest share of subsidies (€30 billion), followed by wind (€21 billion), and biomass (€18 billion). Renewable energy is also supported by EIB loans (roughly €4.4 billion in 2020).
Endnotes
1. See Committee for a Responsible Federal Budget, ‘CBO Scores IRA with $238 Billion of Deficit Reduction’, 7 September 2022. The IRA’s name is justified by the fact that it is expected to reduce net public spending, as new expenditures of $499 billion ($391 billion for energy and climate, and $108 billion for healthcare) are expected be offset by $457 billion in tax revenues, and $281 billion in healthcare savings.
2. Other green spending includes support for increased efficiency for buildings and industries (estimated at $20 billion), $20 billion for competitive grants to support greenhouse gas reduction projects, and $3.2 billion for carbon sequestration.
3. For example, an electric vehicle using a US-produced 75kWh battery pack manufactured using US-sourced critical materials could benefit from the 10 percent production cost tax credit for these materials, a $3,375 battery production subsidy, and the electric vehicle consumer tax credit of $7,500. In contrast, clean-tech investment and production tax credits cannot be combined (see Box 1).
4. Vehicles have to have a price below $80,000 for SUVs, vans and pickup trucks, and $55,000 for other passenger vehicles (30D U.S.C. §26 (f) (11)), and only consumers with a household income below $150,000 for singles, $225,000 for ‘household heads’ and $300,000 for joint filers can claim the tax credit (30D USC §26 (f) (10)). Consumers below a certain income threshold can also receive a tax credit or up to $4000 for the purchase of a used electric vehicle with a value below $25,000.
5. According to BloombergNEF, average battery electric vehicle cell prices were $115/kWh in 2022, which implies that the production tax credit would make up approximately 30 percent of the average cell price. A producer of a 75/kWh battery pack could be entitled to a tax credit of up to $3,375, making up approximately 28 percent of the price of a battery pack in the US in 2022. US battery pack prices averaged at 1.24x$127 = $11,811/kWh in 2022. See https://www.orrick.com/en/Insights/2022/11/Section-45X-of-the-Inflation-Reduction-Act-New-Tax-Credits-Available-to-Battery-Manufacturers.
6. The US Treasury Secretary can allocate up to $2.3 billion as part of such a programme, with selection according to social and environmental benefits. This programme can be extended to up to $10 billion (26 USC §48C).
7. Projects larger than 1 megawatt have to comply with apprenticeship and labour requirements 26 USC §45Y). Under the extended legacy rules, the subsidy for wind projects can be as high as $0.026/kWh. See https://www.epa.gov/lmop/renewable-electricity-production-tax-credit-information.
8. Projects larger than 1 megawatt have to comply with apprenticeship and labour requirements to be eligible for the full credit (26 USC §45E).
9. $0.006/kg of produced hydrogen, depending on the carbon emissions involved in the production; this can rise to up to $3/kg of hydrogen if certain labour conditions are satisfied. Clean fuels can receive up to $1.75/gallon in production subsidies (26 USC §45V).
10. See https://ustr.gov/trade-agreements/free-trade-agreements.
11. For offshore wind, 20 percent in 2025, rising to 55 percent in 2028. For all other renewable energy production facilities, 40 percent in 2025, rising to 55 percent in 2027.
12. The CBO (2022) estimates that for green energy production and investment subsidy that include domestic content, bonuses are $62.3 billion and $64.8 billion, respectively. This can be written as 56.6+56.6/10 for a 10 percent production domestic content bonus and 48.6 + 48.6/3 for the 10 percentage point investment domestic content bonus.
13. For this reason, Credit Suisse (2022) estimated that the budgetary costs of the IRA could be three times higher than projected by the CBO (2022). The discrepancy is particularly large for manufacturing tax credits, which Credit Suisse projects at $250 billion instead of $37 billion. This is based on the assumption that the subsidies will make US producers cost competitive in the manufacturing of wind and solar power equipment, capturing 90 percent of the respective domestic US markets by 2030.
14. How robust would this comparison be to the addition of state-level support on the US side and of (non-IPCEI) state aid on the EU side? With respect to electric vehicle purchases and renewable energy subsidies, the message would be much the same. California provides state-level electric vehicle subsidies of up to $2000 to the federal subsidy, making the average US subsidy level somewhat more generous than that in the EU. Renewable energy support at the state level would also add to the US total, but the overall US level would still appear to be much smaller than that in the EU. According to a 2020 report by the International Renewable Energy Agency, total renewable energy support amounted to $6.7 billion in the US in 2017, against €78 billion in the EU (Taylor, 2020). With respect to clean-tech manufacturing, we do not know the answer. Allocating both (non-IPCEI) state aid in the EU and state-level subsidies in the US to clean manufacturing requires an extensive data effort.
15. Andrés Vlasco, ‘A Subsidy War Without Winners’, Project Syndicate, 27 January 2023.
16. This effect is often credited with triggering the collapse in the cost of photovoltaic solar cells in the last 20 years.
German subsidies for renewable electricity production in the 1990s and 2000s initially benefitted German producers, but when domestic supply did not meet demand, Chinese producers stepped in by selling their goods to the German market, subsequently increasing their market share and slashing costs worldwide. See Lazard (2021), Gallagher (2017), Hoppmann et al (2014) and Grau el al (2012).
17. See Larsen et al (2022), Jenkins et al (2022) and Joe Lo, ‘After finally passing a climate bill, US calls on others to act’.
18. Robinson Meyer, ‘The Biggest Thing to Happen in International Climate Diplomacy in Decades’, The Atlantic, 31 August 2022.
19. Estimate based on current market prices, which may however increase as a result of the subsidy. The average new vehicle sold in the US in 2021 cost $42,000, for which the $7,500 subsidy would represent an 18 percent reduction. This is the average for all vehicles including premium electric vehicles. Source: https://www.statista.com/statistics/274927/new-vehicle-average-selling-price-in-the-united-states/.
20. EU automotive exports to the US were €26 billion in 2021, 6 percent of all EU exports, according to Eurostat.
21. See https://uscode.house.gov/view.xhtml?req=(title:26%20section:45W%20edition:prelim).
22. According to an undated US Treasury white paper, “Treasury and the IRS expect to propose that the Secretary may identify additional free trade agreements for purposes of the critical minerals requirement going forward and will evaluate any newly negotiated agreements for proposed inclusion during the pendency of the rulemaking process or inclusion after finalization of the rulemaking.”
23. The production of raw materials that are can be used in clean tech receives 10 percent of their production cost as tax credits. The production of an electric vehicle battery would receive subsidies equivalent to roughly 30 percent of its 2022 price, while the production of components for a wind turbine can receive $0.15 per watt of capacity. The average price of a wind turbine in 2021 was around $900 per kW, meaning that this production subsidy would amount to 16 percent (see DOE, 2022).
24. At current cost, the $0.07/watt IRA production subsidy for solar panels would amount to 26 percent of the price of a solar panel (see https://ourworldindata.org/grapher/solar-pv-prices), giving a significant boost to US based manufacturing.
25. In the last decade, the price of solar panels has fallen by 95 percent, while the cost of electric vehicle batteries has fallen from $5/watt in 2012 to $0.27/watt in 2022.
26. In the case of clean energy subsidies there is a 10 percentage bonus on the tax credit received if components used come from the US, and an extra 10 percentage points in the case of a 30 percent investment subsidy.
27. See https://www.ipcei-batteries.eu/.
28. For the first IPCEI on microelectronics, average funding was 28 percent of eligible project cost. See Poitiers and Weil (2022) for a discussion.
29. Between 2019 and 2022, industrial electricity prices increased from around $0.10/kWh in the EU and $0.07/kWh in the US to around $0.20/kWh in the EU compared to only $0.08/kWh in the US. Between 2019 and 2022, the spread between the EU and the US increased from $0.03/kWh to around $0.12/kWh.
30. In a simple market design (‘merit order’), the price of electricity is set by the cost of the most expensive source that is needed to produce sufficient power (gas in many EU markets). The electricity price changes due to a change in the most expensive source still in the market, not by directly lowering the cost of renewable energy generation itself.
31. According to Bloomberg NEF, $27.7 billion in investments in electric vehicle and battery manufacturing in the US has been announced since the passing of the IRA.
32. Since the WTO’s inception in 1995, its members have referred more than 600 disputes to the WTO dispute settlement mechanism, with 159 complaints filed against the United States by 29 WTO members, and 116 disputes launched by 30 WTO members against the European Union, its predecessors and member states.
33. Clea Caulcutt, ‘Emmanuel Macron calls for “Buy European Act” to protect regional carmakers’, Politico, 26 October 2022.
34. 2020 aid disbursed is a more reliable gauge of the potential distortionary impact of the temporary crisis framework than aid approved under the 2022 framework put in place after the Russian invasion of Ukraine. However, Commission Executive Vice-President Margrethe Vestager cited the aid under the 2022 framework in a widely-reported January 2023 letter to EU governments (see for example https://www.ft.com/content/85b55126-e1e6-4b2c-8bb2-753d3cafcbe5), though this refers to approvals of aid which may not in the end be granted by governments; if it is granted, it may be disbursed over several years. The shares of approved aid granted, and the length of the disbursement period may vary greatly between countries. Furthermore, aid approved refers to nominal amounts, mixing loans and grants, rather than to the aid content.
35. To adjust for differences in the magnitude of shocks, we ran a cross-sectional regression of the COVID-19 state aid shown in the left panel of Figure 2 on a measure of the economic shock, namely, the difference between the winter 2020 real growth projections published by the European Commission in February 2020, just before COVID-19, and the 2020 real growth outturns. The residual from that regression can be interpreted as the shock-adjusted level of COVID-19 aid. Consistent with the findings of Cannas et al (2022), the slope coefficient indicates a statistically significant correlation between the size of the shock and the level of COVID-19 aid. However, the regression fit is very low (R2=0.12), indicating that most of the variance of state aid is not explained by differences in the shocks. The difference between lowest and highest shock-adjusted aid level is 4 percentage points of GDP (even higher than in the raw data), and the standard deviation is 0.93 percentage points of GDP, almost as high as that of the raw data.
36. Case law supports a restrictive reading of 107(3)(b) TFEU (“serious disturbances”). The ruling in Freistaat Sachsen and Others v Commission of the European Communities (1999) found that “the disturbance in question must affect the whole of the economy of the Member State concerned, and not merely that of one of its regions or parts of its territory” (see https://eur-lex.europa.eu/legal-content/EN/TXT/PDF/?uri=CELEX:61996TJ0132_SUM). Before COVID-19 and Ukraine, 107(3)(b) TFEU was used most extensively during the 2008-09 global financial crisis. We thank Armin Steinbach for pointing us to this case law and Commission practice.
37. See European Parliament press release of 9 December 2022: https://www.europarl.europa.eu/news/en/press-room/20221205IPR60614/batteries-deal-on-new-eu-rules-for-design-production-and-waste-treatment.
38. Such schemes already exist in EU countries, notably in Germany; see https://www.bmwk.de/Redaktion/EN/Dossier/regulatory-sandboxes.html. EU countries endorsed regulatory sandboxes in November 2020: https://www.consilium.europa.eu/media/46822/st13026-en20.pdf.
39. Environmental criteria in public procurement should be handled carefully, as they might expose officials to lobbying and electioneering (for instance, in view of protecting local producers against competition; Blanchard et al 2022). But this risk could be mitigated by using precise and easy-to-verify award criteria (eg. CO2 emissions of cars or carbon intensity of electricity) rather than imprecise and hard-to-verify criteria (eg. environmental criteria related to the suppliers). This requires a clear categorisation of green criteria, as well as adequate investment in the training of public authorities that have to apply them (Sapir et al 2022).
40. The European Commission has said it will propose electricity market reform early in 2023.
41. Connall Heussaff and Georg Zachmann, ‘Buying time for proper electricity market reform’, Euractiv, 21 December 2022.
42. See https://news.industriall-europe.eu/Article/860.
43. See Paola Tamma, ‘Eurozone countries kill banking union plan’, Politico, 9 June 2022.
44. See European Commission press release of 7 December 2022, https://ec.europa.eu/commission/presscorner/detail/en/ip_22_7348.
45. See García-Herrero and Poitiers (2022).
46. See Tagliapietra and Veugelers (2021) on how to design such green-subsidy programmes at EU level.
47. This will be financed through the frontloaded sale of emissions trading system allowances (40 percent) and the resources of the Innovation Fund (60 percent). The distribution of these extra resources will take into account cohesion policy, EU countries’ dependence on fossil fuels and the increase in investment prices. See https://www.europarl.europa.eu/legislative-train/theme-a-european-green-deal/file-repowereu-chapters-in-recovery-and-resilience-plans.
48. Any such programme should take lessons past initiatives into account; see Claeys (2015) and Claeys and Leandro (2016).
49. Including the G7 and its climate club initiative, the G20, the Organisation for Economic Co-operation and Development, the WTO Trade and Environment Committee and WTO Trade and Environmental Sustainability Structured Discussions (TESSD), and the recently founded Coalition of Trade Ministers on Climate.
50. Article 107(3)(b) of the Treaty on the Functioning of the European Union states that “aid to promote the execution of an important project of common European interest” is compatible with the internal market.
51. The European Commission reports state aid disbursements in broad policy categories, several of which (including ‘Environmental protection including energy savings’, ‘Regional development’, ‘Sectoral development’, ‘SMEs including risk capital’ and ‘Other’) could in principle contain such support. European Commission (2022a), Annex II also lists the largest individual aid items in these categories disbursed in 2020, the most recent year for which this data is available. Except for the IPCEIs (reported in ‘Other’) we were not able to find any item in this list that specifically reflects clean-tech manufacturing support. However, some of the generic industry support packages reported in the categories ‘Regional development’ and ‘SMEs including risk capital’ could reflect disbursements to clean tech producers.
References
Autor, D, D Dorn and G Hanson (2021) ‘On the persistence of the China shock’, NBER Working Paper w29401, National Bureau of Economic Research
Beck, T, J-P Krahnen, P Martin, FC Mayer, J Pisani-Ferry, T Tröger, N Véron, B Weder di Mauro and J Zettelmeyer (2022) ‘Completing the banking union: Economic requirements and legal conditions’, Policy Insight 119, Centre for Economic Policy Research
Blanchard, O, C Gollier and J Tirole (2022) ‘The Portfolio of Economic Policies Needed to Fight Climate Change’, PIIE Working Paper 22-18, Peterson Institute for International Economics.
Cannas, G, S Ferraro, A Mathieu Collin, and K Van de Casteele (2022) ‘Looking back at the State aid COVID Temporary Framework: the take-up of measures in the EU’, Competition State aid Brief 3/2022, European Commission, available at https://competition-policy.ec.europa.eu/system/files/2022-11/state_aid_brief_3_2022_kdam22003enn_coronavirus.pdf
Claeys, G (2015) ‘Juncker plan: the EIB in the driver’s seat’, Bruegel Blog, 1 July.
Claeys, G and A Leandro (2016) ‘Assessing the Juncker Plan after one year’, Bruegel Blog, 17 May.
Clausing, K and C Wolfram (2023) ‘Asymmetric Climate Policies and International Trade’, mimeo
CBO (2022) Estimated Budgetary Effects of Public Law 117-169, to Provide for Reconciliation Pursuant to Title II of S. Con. Res. 14, US Congressional Budget Office.
Credit Suisse (2022) US Inflation Reduction Act: A catalyst for climate action, Treeprint.
DOE (2022) Land-Based Wind Market Report: 2022 Edition, US Department of Energy.
European Commission (2020) European Skills Agenda for sustainable competitiveness, social fairness and resilience.
European Commission (2022a) State aid Scoreboard 2021.
European Commission (2022b) ‘Guidelines on State aid for climate, environmental protection and energy 2022’, 2022/C 80/01.
European Commission (2023) ‘A Green Deal Industrial Plan for the Net-Zero Age’, COM(2023) 62 final.
Gallagher, K (2017) The Globalization of Clean Energy Technology: Lessons from China (Urban and Industrial Environments), MIT Press
García-Herrero A and N Poitiers (2022) ‘Europe’s promised semiconductor subsidies need to be better targeted’, Bruegel Blog, 17 October.
Glachant, JM (2023) ‘Reforming the EU internal electricity market in the middle of a huge energy crisis: an absolute short-term emergency or preparation for the future?’ Working Paper, Florence School of Regulation.
Grau, T, M Huo, and K Neuhoff (2012) ‘Survey of photovoltaic industry and policy in Germany and China’, Energy Policy 51: 20–37.
Hoppmann, J, J Huenteler and B Girod (2014) ‘Compulsive policy-making—The evolution of the German feed-in tariff system for solar photovoltaic power’, Research Policy 43(8): 1422–41.
IEA (2022) Skills development and inclusivity for clean energy transitions, International Energy Agency.
Jenkins, JD, EN Mayfield, J Farbes, R Jones, N Patankar, Q Xu and G Schivley (2022) Preliminary Report: The Climate and Energy Impacts of the Inflation Reduction Act of 2022, Princeton University – Zero Lab.
Kleimann, D (2023) ‘Climate versus trade? Reconciling international subsidy rules with industrial decarbonisation’, Policy Contribution 03/2023, Bruegel.
Larsen, J, B King, H Kolus, N Dasari, G Hiltbrand and W Herndon (2022) A Turning Point for US Climate Progress: Assessing the Climate and Clean Energy Provisions in the Inflation Reduction Act, Rhodium Group.
Lazard (2021) ‘LAZARD’s levelized Cost of Energy (‘LCOE’) Analysis — version 15.0’, Lazard.
Leggett, JA and JL Ramseur (2022) Inflation Reduction Act of 2022 (IRA): Provisions Related to Climate Change, CRS Report R47262, Congressional Research Service.
Mazzucato M (2013) The Entrepreneurial State. Debunking Public vs. Private Sector Myths, Anthem Press, London
Poitiers, N and P Weil (2022a) ‘Opaque and ill-defined: the problems with Europe’s IPCEI subsidy framework’, Bruegel Blog, 26 January.
Poitiers, N and P Weil (2022b) ‘Is the EU Chips Act the right approach?’ Bruegel Blog, 2 June.
Rodriguez Quintero, R, C Vidal Abarca Garrido, H Moons, M De Oliveira Gama Caldas, O Wolf, I Skinner, A Van Grinsven, M Hoen and H Van Essen (2019) Revision of the EU Green Public Procurement Criteria for Transport, JRC Science for Policy Report, Joint Research Centre
Roy, N, D Burtraw and K Rennert (2021) ‘Cost Analysis and Emissions Projections under Power Sector Proposals in Reconciliation’, Issue Brief 21-15, Resources for the Future.
Sapir, A, T Schraepen and S Tagliapietra (2022) ‘Green Public Procurement: A Neglected Tool in the European Green Deal Toolbox?’ Intereconomics 57(3): 175-178.
Schlecht, I, L Hirth and C Maurer (2022) ‘Financial Wind CfDs’, Working Paper, ZBW – Leibniz Information Centre for Economics.
Sherman, W (2023) ‘Remarks at Brookings Global China Event’, 15 February.
Tagliapetra, S and R Veugelers (2021) ‘Fostering the Industrial Component of the European Green Deal: Key Principles and Policy Options’, Intereconomics 56(6): 305-310
Taylor, M (2020) ‘Energy subsidies: Evolution in the global energy transformation to 2050’, Technical Paper 1/2020, International Renewable Energy Agency.
Véron, N (2014) ‘Defining Europe’s Capital Markets Union’, Policy Contribution 2014/12, Bruegel.
This article is based on the Bruegel Policy Contribution Issue no04/23 | February 2023. The authors thank Daron Acemoglu, Laurence Boone, Grégory Claeys, Kim Clausing, Uri Dadush, Zsolt Darvas, Olivier Debande, Maria Demertzis, Kelly Gallagher, Antoine Mathieu Collin, Małgorzata Kałużyńska, Marie Le Mouel, Jean Pisani-Ferry, Armin Steinbach and John Van Reenen for discussions or correspondence on the topic and comments on an earlier draft. Conor McCaffrey and Cecilia Trasi provided outstanding research assistance.