
Talking about competitiveness in Europe: productivity not protection
Filippo di Mauro is a Senior Fellow, and Marco Matani a Consultant, at the Halle Institute For Economic Research (IWH)
Ursula von der Leyen has put competitiveness in Europe at the top of the economic agenda with her latest State of the Union address. And rightly so. Gaining competitiveness means making better use of the resources and ultimately increasing the productivity of the overall economic system.
On this, the record for Europe is dismal and action is urgently needed. Latest CompNet data show that total factor productivity (TFP) in Europe has been stagnant over the last two decades with negative blips both during the 2009 global financial crisis (GFC) and most recently during COVID in 2020.
Why was it so? Out of the many reasons, in this column we focus on the external factors to conclude that China was not the problem, but more likely some other, very internal ones, including the strong negative impact during crises times of within-EU global value chain (GVC) operations, amid an overall productivity sluggishness. Among the overall competitiveness drivers, we identify productivity and innovation content as key.
The role of EU global value chains
To do so, we examine how the TFP of European firms is affected by their external environment, particularly via the conduit of the GVCs to which they are connected.
Drawing from Bertelsman et al (2008) as well as Chiacchio et al (2018), we disentangle productivity transmission inside GVCs stretching within EU borders, within two phases. In a first phase, an external productivity shock (eg. an invention on the positive side or a sudden supply disruption on the negative side) has an immediate impact on the frontier (ie. most productive) firms, which are directly connected via trade flows to the respective GVC.
In a second phase, after a learning process, productivity gains trickle down from the national frontier to other national firms through domestic production networks.
To measure such impacts, we link CompNet data on firms’ productivity with their respective trade linkages as reported by the OECD Inter-Country Input-Output (ICIO) tables. The productivity of each country and macro-sector is the employment-weighted average of laggard, frontier, and average firms (firms in the bottom 20%, top 20%, and intermediate deciles, respectively, of the productivity distribution of each country and macro-sector).
Hence, we aim to capture the following contributions to the TFP growth rates of each country and macro-sector each year:
-The transmission of TFP rates of change from the respective GVC frontier (ie. from the average TFP growth rate across foreign countries and macro-sectors that import from the given country and macro-sector).
-The ‘catch-up’ effect – whether being more distant from the GVC frontier (in terms of a labour productivity gap) benefits TFP growth of national firms.
-Overall GVC participation (increases in percentage points of exports over output from one year to the other).
-Separately, other COVID and GFC shocks.
-Time-invariant features of each country and macro sector.
-Time-varying unexplained factors affecting TFP growth (on top of systemic COVID and GFC shocks).
The results (see Figure 1) are as follows1.
Figure 1. Contributions to EU TFP growth rates within EU global value chains
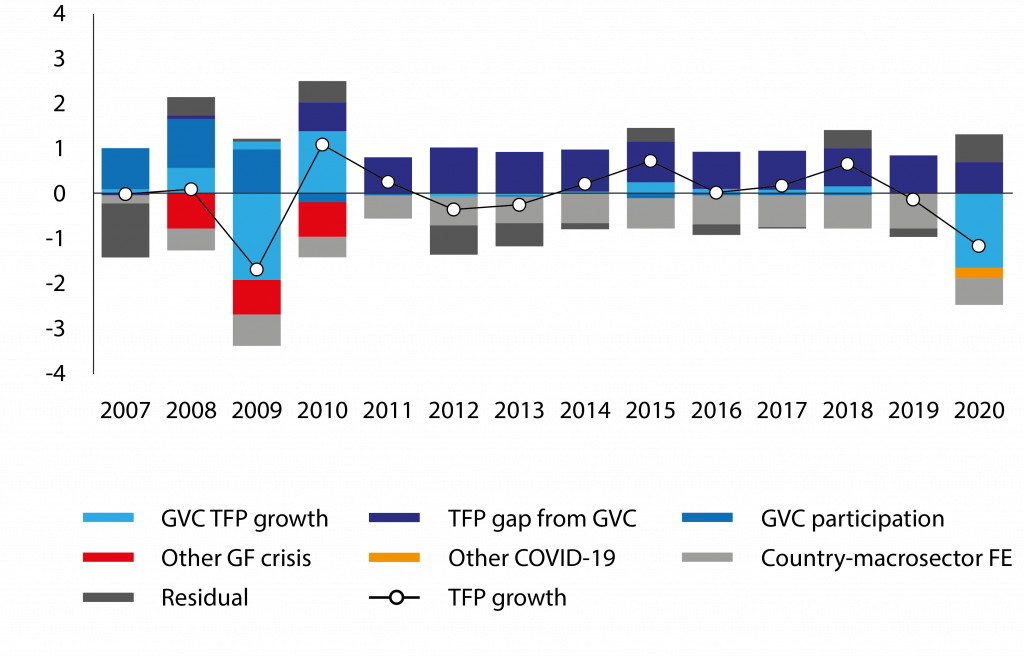
Note: Figures are yearly averages across countries and macro-sectors weighted by real value added. Results for export linkages between BE, CH, CZ, DE, DK, ES, FI, FR, HR, HU, IT, LT, LV, MT, NL, PL, PT, RO, SI, SK, and SE. Unbalanced sample over 2005-2020. The latest available year is 2018 for DE, and 2019 for LV and NL.
Source: CompNet 9th Vintage (jd_inp_prod_industry2d_20e_weighted) and OECD ICIO.
1. As expected, the TFP growth of the EU GVC counterparts (the dashed blue histogram) has a rather strong impact on the TFP of the economy as it directly affects the frontiers firms connected to them.
2. What is notable is that such impacts become very strongly negative at the time of crisis (see the large negative histogram in 2009 and 2020)2. This is reminiscent of evidence of an additional burden from COVID on European firms in GVCs (Lebastard et al 2023), and its sources – which may trace back to elements such as inventory management (Lafrogne-Joussier et al 2022), prevalence of arm’s-length rather than intra-group transactions (Altomonte et al 2012), or risk misperception (Baldwin and Freeman 2022) – deserve further investigation.
3. The most positive contribution to aggregate TFP growth, however, comes from the productivity gap of the various countries and macro-sectors with respect to their respective within-EU GVC counterparts. The intuition is that when this gap is large, there is possibly a Balassa-Samuelson kind of ‘catching-up effect,’ which could be activated.
4. On the other hand, and paradoxically given the current debate, the residual, which would include the China effect together with the remaining time-varying omitted factors, has a small and often actually positive contribution to the TFP growth.
Overall, it would seem therefore that the shock that is internal to EU GVCs (ie. European firms trading with other European firms) may be more relevant in explaining TFP growth fragility amidst crises and generalised sluggishness (the always negative ‘country-macro-sector FE’) than any residual Chinese one.
There are critical factors internal to the EU which could be better activated to enhance firms’ productivity and ultimately foster their global competitiveness
Drivers of external competitiveness
The 2023 State of the Union speech neatly advocated for true and fair competition. It also stated that European companies recognise global competition being good for business and a pivot to create and protect good jobs in Europe.
In this context, ‘predatory’ practices benefitting competitors and marginalising European firms on foreign markets have been stigmatised. An anti-subsidy investigation into electric vehicles coming from China was also announced.
Nurturing a vibrant competitive environment requires policymakers to identify those aspects that are most relevant for sound firm performance (di Mauro and Forster 2008, Karadeloglou et al 2015). Building on previous work by Amador et al (2022) and Lourenço et al (2022), and in collaboration with a team at the Portuguese Gabinete de Estratégia e Estudos (GEE), we built a novel micro-aggregated composite indicator using CompNet data.
Our version of the Enterprise Competitiveness Indicator (ECI) considers five dimensions of performance – returns, costs, productivity, risks, and quality orientation (CompNet 2023: 29-34) – for the average firm in each country. When putting it to work, the ECI seems to offer insights into the drivers of EU firms’ demeanour on global markets (Figure 2).
Figure 2. ECI by dimension, REER, and export market shares
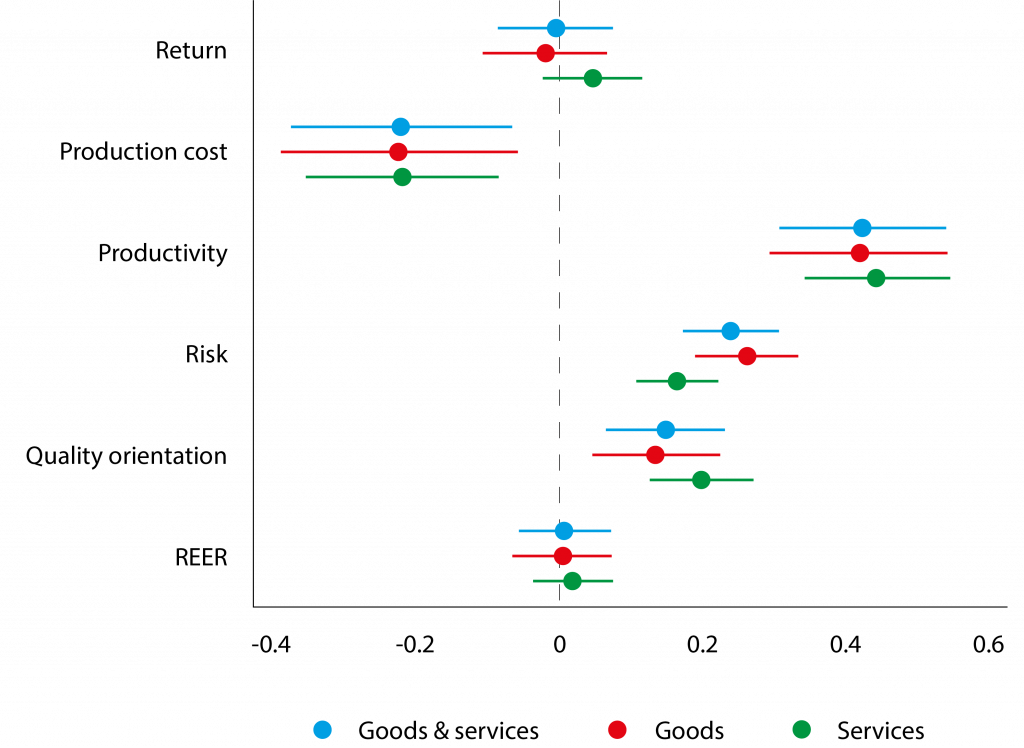
Note: Coefficients from regressing market shares on ECI dimensions (pooled, each computed like in CompNet, 2023 pages 29-34) and Eurostat real effective exchange rates (REERs) with year fixed effects. REERs are the nominal effective exchange rates (NEERs) for 42 trading partners deflated by consumer price indices (CPIs). Results for BE, CZ, DE, DK, ES, FI, FR, HR, HU, IT, LT, LV, MT, NL, PL, PT, RO, SI, SK, and SE. The latest available years are 2019 for LV and NL, and 2018 for DE.
Source: CompNet 9th Vintage (unconditional_mac_sector_20e_weighted) and Eurostat
Our results suggest that productivity, financial soundness (risk), and quality orientation correlate with higher EU countries’ export market shares more often than profitability (return) and, even more strongly, production costs. Also exchanges rates appear scarcely related to trade developments (see Grazioli et al 2016 for further on this).
Intuitively, this correlational evidence may point to European exporters being specialised in more downstream, higher value-added stages of value chains (eg. Bontadini et al 2021). If so, curbing artificial low prices would speak only less directly to the competitiveness of EU firms, while other factors appear more in tune with navigating international competition on those markets where the EU comparative advantages are stronger.
Conclusions
That competitiveness is now at the top of the EU economic agenda is welcome. But it is important to choose appropriately the channels one needs to tackle to improve it.
In this column, we have provided evidence that there are critical factors internal to the EU which could be better activated to enhance firms’ productivity and ultimately foster their global competitiveness.
First, the GVCs operating within Europe itself have a rather strong impact on the aggregate productivity of Europe, as they directly affect the frontier firms connected to them. The robustness and resilience of these GVCs should be enhanced3.
The still rather large gaps existing between frontier and laggard firms maintain a strong momentum for ‘catching-up’ forces, which is also positive for the aggregate productivity of Europe.
In comparison, the impact on the latter of GVCs outside of Europe (including therefore China) is shown to be somewhat limited and at any rate mostly positive.
When we look at the determinants of export market shares of EU firms, we show that productivity, financial soundness (risk), and quality orientation are the most important factors. Rather than, for instance, imposing across-the-board controls on imports, those are the things to concentrate on and most likely what it will take to maintain and enhance the EU’s competitive edge.
Endnotes
1. Results are robust to utilising import linkages and to controlling for growth rates of exports toward major non-European partners (CN, IN, JP, KR, MX, RU, TR, US). These results are available upon request to the authors.
2. Note that 2021 OECD ICIO data are available only up to 2018. We assume that the structure of EU GVCs did not change between 2018 and 2020. Since COVID reasonably twisted firms away from their ideal portfolio of trade partners, we may underestimate the magnitude of the GVC TFP shock in 2020.
3. See Miroudot (2020) for a discussion of the distinction between resilience and robustness in GVCs.
References
Altomonte, C, F di Mauro, G Ottaviano, A Rungi and V Vicard (2012), “Global value chains are not all born identical: Policymakers beware”, VoxEU.org, 4 January.
Amador, J, A Fernandes and G Nogueira G (2022), “The competitiveness of the Portuguese economy: A view from a composite indicator”, Banco de Portugal Economic Studies VIII: 29–54.
Baldwin, R and R Freeman (2022), “Global supply chain risk and resilience”, VoxEU.org, 6 April.
Bartelsman, EJ, J Haskel and R Martin R (2008), “Distance to which frontier? Evidence on productivity convergence from international firm-level data”, CEPR Discussion Paper 7032.
Bontadini, F, R Evangelista, V Meliciani and M Savona (2021), “Patterns of integration in global value chains and the changing structure of employment in Europe”, Working Paper 12/2021, Luiss University.
Chiacchio, F, K Gradeva and P Lopez-Garcia (2018), “The Post-Crisis TFP Growth Slowdown in CEE Countries: Exploring the Role of Global Value Chains”, Working Paper Series 2143, European Central Bank.
CompNet (2023), Firm Productivity Report, July.
di Mauro, F and K Forster (2008), “Globalisation and the competitiveness of the euro area”, ECB Occasional Paper 97.
Grazioli, M, S De Pinto, F di Mauro and K Benkovskis (2016), “Fighting ‘currency wars’ with blanks: The limited role of exchange rates in export competitiveness”, VoxEU.org, 29 June.
Karadeloglou, P, K Benkovskis, G Aiello et al. (2015), “Compendium on the Diagnostic Toolkit for Competitiveness”, Occasional Paper Series 163, European Central Bank.
Lafrogne-Joussier, R, J Martin and I Mejean (2022), “Supply chain disruptions and mitigation strategies”, VoxEU.org, 5 February.
Lebastard, L, M Matani and R Serafini (2023), “Understanding the impact of COVID-19 supply disruptions on exporters in global value chains”, VoxEU.org, 24 March.
Lourenço, M, C Magalhães, F Martins, MC Pereira and H Reis (2022), “Uma análise da competitividade das empresas em Portugal e em alguns países europeus”, Banco de Portugal Occasional Papers.
Mirodout, S (2020), “Resilience versus robustness in global value chains: Some policy implications”, VoxEU.org, 18 June.
This article was originally published on VoxEU.org.


