Is Europe failing on import diversification?
Lennard Welslau is a Research Assistant, and Georg Zachmann a Senior Fellow, at Bruegel
In the discussion on European Union strategic sovereignty – the idea that the EU should not be dependent on other economies – there are broadly two approaches. The first is that a certain degree of self-sufficiency (autarky) is needed, at least in ‘strategic’ industries. The second is that strategic sovereignty can be achieved by ensuring that strategically important imports from one country can be substituted by imports from another – in other words, through sufficient import diversification.
But to what extent are Europe’s imports already diversified, and how has diversification developed over time? The European Commission has published two in-depth reviews of EU strategic dependencies and capacities (2021, 2022), identifying 137 products for which the EU is highly dependent on imports, especially from China. These products are mostly in the energy-intensive, health and tech industries.
Overall, however, the reviews found that extra-EU trade is diversified and the level of import concentration has remained stable over the last decade. While this may be true for aggregate imports, our analysis suggests it underplays the extent to which imports in several sectors have become more concentrated over time.
For a deeper look at current trends, and to draw out the role of China, we examined import data for 6,887 products imported by the EU between 2001 and 2022. We used an indicator of import diversification (the Herfindahl-Hirschman-Index (HHI); see the annex for details) to assess which products are imported from many countries, and which are imported from only a few.
The Commission’s in-depth reviews focused on trends for aggregate imports and only carried out a more detailed analysis for a single year and for a limited selection of products.
We provide a more detailed analysis for the entire period, by breaking down the data by industry, technology and end-use, and constructing two alternative indicators to highlight the specific role of China in the concentration of EU imports.
Overall, we see big differences in the extent to which products are concentrated in certain countries. For some products (eg. vegetable seeds in 2022) EU imports are very diversified, while other products are only sourced from one country (eg. 2022 imports of sulphur dichloride from India).
Figure 1 plots the average concentration level for European imports between 2001 and 2022, with a higher number indicating greater concentration of imports among certain exporting countries. Interestingly, despite the surge in globalisation that involved more countries in international trade in the past decades, EU imports became substantially more concentrated in a smaller number of countries between 2001 and 2016, with the level of concentration slightly receding since.
Figure 1. Concentration indicator for European imports

Note: Blue line shows average Herfindahl-Hirschman Index (HHI) of EU imports disaggregated at HS 6-digit level, weighted by respective import volumes for the entire period. Shaded area represents interquartile range. See the annex for an explanation of the indicator.
Source: Bruegel based on Eurostat.
One explanation for the increasing concentration of import sources for many products is that it has been driven by the rise of China. To test this, we calculated two alternative indicators: one in which imports from China are assumed to zero but the overall volume of EU imports is assumed to be the same, with imports from other countries scaled up in line with their current market shares to fill the Chinese gap, and one in which imports from China are ignored completely (ie. Chinese imports are zero while imports of other countries remain unchanged; as a result of the overall smaller import market, the market share of other countries’ imports increases).
The actual and alternative concentration indicators start at very similar levels in 2001, but as China’s share of European imports increased, concentration increased significantly based on the actual data, but not for the alternative indicators with China stripped out.
For the first alternative indicator, concentration drops (Figure 2, left panel), because China is assumed to have been replaced as a supplier by an infinite number of small exporters.
Surprisingly, the second alternative indicator (Figure 2, right panel) also shows a lower than actual level of concentration. That is, imports of goods from countries other than China would be more diversified, despite the assumed reduction in market size, possibly as a result of new exporters competing with old exporters for the European market.
High import concentration threatens resilience and worsens European terms of trade through higher mark-ups; tools that encourage greater import diversification should be employed to reverse the trend
Figure 2. Concentration of European imports, baseline vs. two alternative scenarios

Note: Blue line shows average Herfindahl-Hirschman Index (HHI) of EU imports disaggregated at HS 6-digit level, weighted by average import volume in respective product categories over the entire period. Red line shows the same index for alternative scenarios where (1) Chinese market shares are zero and other countries’ market shares remain unchanged, and (2) Chinese imports are zero and other countries’ market shares increase as a result of the reduced total import volume. Shaded areas represent respective interquartile ranges.
Source: Bruegel based on Eurostat.
Critical resources
The EU discussion on strategic autonomy focuses on specific product categories considered critical for security, safety, health and technology. These are in particular strategic resources and basic materials, and certain high-tech items (especially chips and batteries).
Assessment of the level of import diversification for different product categories shows significantly varying results. The level of diversification is healthy for most resource-based product categories, with the surprising exception of foodstuff (Figure 3, left panel).
For example, imports of fuel products are the most diversified. Imports of manufacturing products, however, are much more concentrated (Figure 3, right panel). Machinery and transport equipment imports seem to drive the overall level of concentration of European imports (Figure 1).
Figure 3. Import diversification, specific product categories
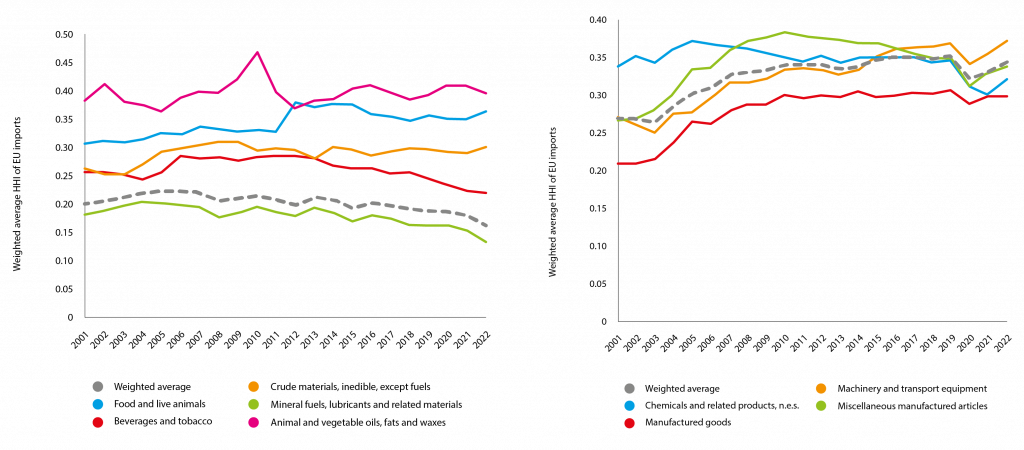
Note: Average Herfindahl-Hirschman Index (HHI) of EU imports disaggregated at HS 6-digit level and SITC sections, weighted by average import volume in respective product categories over the entire period. Dotted grey line represents the average for (1) resource-based and (2) manufacturing products.
Source: Bruegel based on Eurostat.
Import diversification has decreased for more technology-intensive manufacturing products. This is especially true in the high-tech sector, where the increase in concentration over the past decade has been greater than for other types of manufacturing products (Figure 4, left panel).
Reliance on a few importers implies less resilience to supply-chain disruptions, and possibly higher mark-ups on imports of potentially crucial components.
The right panel of Figure 4 shows that import concentration has increased significantly for final goods, while it remained largely stable for intermediate goods, suggesting relative resilience of supply chains for the production of final goods in Europe.
Figure 4. Concentration of European imports by technology and end-use categories
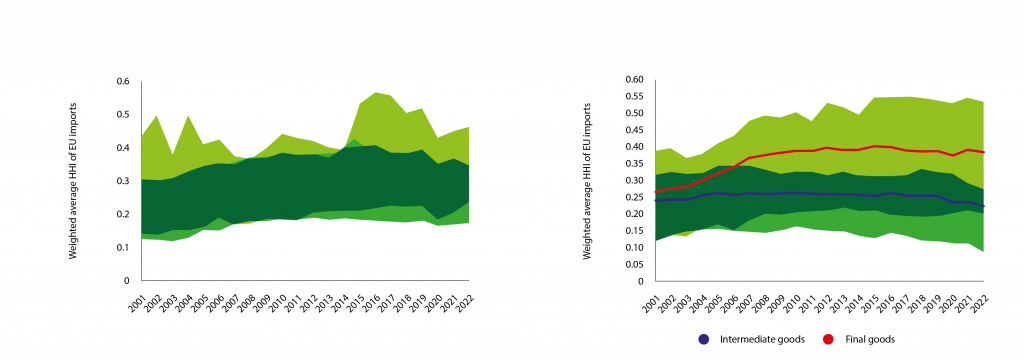
Note: Solid lines show average Herfindahl-Hirschman Index (HHI) of EU imports disaggregated at HS 6-digit level and by technology (1) and end-use categories (2), weighted by average import volume in respective product categories over the entire period. Shaded areas represent respective interquartile ranges.
Source: Bruegel based on Eurostat.
In summary, Europe’s imports are generally sourced from an increasingly concentrated set of exporters. China has played a driving role in this development. While this trend has reversed in some industries in recent years, manufacturing imports – especially high-tech imports – remain at a high level of concentration. This development is driven by final rather than intermediate goods. Since high import concentration threatens resilience and worsens European terms of trade through higher mark-ups, tools that encourage greater import diversification should be employed to reverse the trend.
Annex
Our indicator of import concentration is taken from competition policy – the Herfindahl-Hirschman-Index (HHI). This is computed as the sum of squared market shares within a product category, and ranges from zero, signifying perfect competition (in the case of only 150 export countries the minimum is 0.007), to 1, meaning the EU buys a certain product from a single country. An HHI above 0.25 is considered in the economic literature as an indication of high concentration. The European Commission’s analysis covered a limited range of products with an HHI higher than 0.4.
The diversity of intra-EU trade does not factor into our analysis. Likewise, product codes declared confidential by individual countries are excluded, as they would present ‘artificial’ categories for the respective countries and likely bias the results.
The 6,887 products we analysed are at HS 6-digit level. Products categories are based on the SITC and rely on Eurostat conversion tables. End-use categories are based on OECD conversion tables.
This article was originally published on Bruegel.