Income inequality and the liberal economic order
Shekhar Aiyar is a Non-Resident Fellow at Bruegel, a Visiting Scholar at the Johns Hopkins School of Advanced International Studies and a Visiting Professor at the National Council of Applied Economic Research
1 Introduction
The liberal international economic order – that venerable if teetering construct – has few friends these days. On the right, populists in several countries view it as anathema to a more robust nationalism, which is manifested in the economic sphere by curbs on immigration, restrictions on both the scale and composition of international trade and an aversion to rules-based internationalism. On the left, it is attacked as at best indifferent to, and at worst responsible for, a host of ills, prominent among them inequality, job losses and climate change.
The consequences of this lack of champions for the liberal order are increasingly evident at both the domestic and international levels. In nation after nation, industrial policy is enjoying a renaissance, protectionist barriers are finding fertile soil and immigration is being assailed. At the international level, countries are being asked to choose between opposing blocs, with economic relations with the rival bloc subject to increasing scepticism and scrutiny, while multilateralism is being discarded as ineffectual if not malign.
There are perhaps as many definitions of the liberal economic order as there are economists. But most would agree on a set of distinctive features: market-based economic activity, private entrepreneurship and a legal system that impartially enforces contracts between consenting parties.
The government’s role is not to micromanage economic production or second-guess the price mechanism, but to step in when markets fail, for example to curb monopolies, provide public goods and eliminate or reduce inequality of opportunity among citizens. Liberal economies seek to engage in free trade with other economies without favouring domestic firms over foreign firms. They welcome new ideas and new immigrants, and broadly value cosmopolitanism over homogeneity.
On the international stage, they adhere to a rules-based system of dispute resolution and crisis management, even when this system produces outcomes not to their liking.
Clearly this is the ideal, not the uncaveated reality. But the ideal itself has long had a powerful impact on the economic organisation and institutions of both Western and non-Western countries. Following the end of the Cold War and the reforms of Deng Xiaoping, something close to a universal consensus developed around the liberal economic order, even a sense of inevitability as expressed in Francis Fukuyama’s ‘end of history’.
Many countries that were formerly part of the Soviet bloc, and many in the global South with chequered histories of state-led development and import substitution now aspired – however haltingly – towards the liberal ideal. But any semblance of inevitability has long evaporated.
Perhaps the most searing indictment of the liberal international economic order – especially but not exclusively from the left – is that it has led to rising income inequality. This is often singled out as the most fundamental driver of a wave of populism, bringing in its wake scepticism towards international trade, immigration and multilateralism, and creating political dysfunction on both sides of the Atlantic.
But the fundamental premise of this narrative is doubly wrong, or at least parochial in a sense that is rarely advertised. In fact global inequality has declined considerably in recent decades. And this has happened primarily because in two gigantic population centres, China and India, liberal reforms have supercharged their economic trajectories and pulled them closer to Western living standards, resulting in much more equality between citizens of the world. From a bird’s eye perspective, this is the big economic story of the world over the past half century.
Since China and India began liberalising their economies and opening-up to the world, they have been transformed utterly from the plodding and insular economies that they used to be. Unprecedented growth has occurred at every point along their income distributions, resulting in a broadly shared flowering of prosperity.
The number of people living in absolute poverty – at a subsistence level barely imaginable in the West – has fallen by over 1 billion. This is the fastest recorded rate of poverty reduction in world history. The material prospects of the average person born today in China or India are immeasurably better than for somebody born in 1970.
It is within rich countries – a relatively narrow sliver of the global population – that income inequality has soared unacceptably over the last several decades. Median incomes have stagnated, while the shares of the richest have risen steeply. In the United States especially, a large fraction of households has reported falling real incomes over a long period.
Inequality of opportunity, reflected especially in the barriers children from low-income families face in building human capital, has tended to stifle the liberal vision of getting ahead on the back of hard work and clever ideas. Urgent policy action is needed to redistribute income, strengthen the social safety net and move in the direction of a level playing field for all citizens.
Far from undermining the foundations of the liberal economic order, such actions would greatly strengthen it.
How should a universalist – somebody who holds that human life has equal worth irrespective of location – regard the sum total of these somewhat contrary developments: the broad and rapid rise in prosperity in China and India, together with the deteriorating income distribution in the West? One way of answering this question is to imagine that you are behind a Rawlsian veil of ignorance and know nothing about your attributes: whether you are young or old, female or male, rich or poor, Chinese or American.
From this perspective, which society would you choose to inhabit, the world of the 1970s or the world of today? Answering this question requires, first, an appreciation of how the global income distribution has changed over time.
2 Measuring inequality
Measuring global inequality is complicated. At the national level, inequality is typically measured using regularly conducted household surveys. A representative sample of households is asked questions about their income or consumption patterns over a certain period of time, typically the past month. The collected data is then used to understand the position of a given household along the income distribution.
For example, one might ask: what is the income level such that 20 percent of the population earns less and 80 percent earns more (ie. the twentieth percentile)? Or: what is the share in national income of the poorest 20 percent of people, or the richest 5 percent, or those between the fortieth and forty-fifth percentile? And so on.
But there are no globally conducted household surveys from which to construct a global income distribution. No consumption survey or household questionnaire covers the whole world. And people in different parts of the world have very different patterns of consumption. Few Quebecois villagers will purchase jalebis or ikat saris, while few residents of a town in Orissa will buy poutine or ice-skates.
Moreover, the relative prices of various goods and services differ significantly across nations. As just one example, non-traded services are typically much cheaper in poor countries than rich countries. A haircut or heart surgery will cost considerably more in London than in Lima, while a taxi ride of identical distance will be more expensive in Miami than Mogadishu.
Constructing a global income distribution is therefore difficult. It requires pooling together national surveys conducted over roughly similar time periods in different countries, while making adjustments to ensure that the surveys are comparable with each other. The best-known such effort was undertaken more than a decade ago by the World Bank economists Bruno Milanovic and Christian Lakner (2013).
They collected and pooled data from 565 household consumption and income surveys from five benchmark years. Country coverage varied by year, but included the vast majority of the world in terms of both population and GDP1. They then converted local prices into US dollars using purchasing power parities, which measure what a similar basket of goods and services would cost across different countries.
This enabled the construction of a world income distribution, measuring the purchasing power of the poorest segment of global citizens irrespective of physical location, the purchasing power of the second poorest segment, and so on, all the way to the richest segment. Each segment might include people from several different countries.
Lakner and Milanovic’s study popularised the so-called ‘elephant graph’, which provides an arresting visualisation of the evolution of global income distribution. The graph shows the growth rate of income from 1988-2008 across different percentiles of the distribution (Figure 1).
Its most striking feature is the stagnation of upper middle-class incomes – those between the seventy-fifth and ninety-fifth percentiles. On the other hand the elephant graph shows very robust growth between the tenth and seventieth percentiles of the distribution. The fastest growth occurred near the median of the distribution; the slowest between the eightieth and eighty- fifth percentiles.
Even at the very bottom of the distribution, incomes grew much faster than for the upper middle-class. The chief winners from this churn were workers in China, India and other relatively low-income countries. The laggards were mostly blue-collar workers in advanced economies, such as the US and Japan, who started out at much higher points in the world income distribution than even relatively prosperous citizens of low-income countries.
A few caveats are in order. The elephant graph does not track the income growth of a particular set of people comprising a particular decile in 1988. Instead, it compares the average income of a given decile in 1988 with the average income of the same decile in 2008. The decile could be – indeed is likely to be – populated by a different set of people across time, since the income of people at different points in the distribution grows at different rates (quite apart from the fact that births and deaths alter the composition of the distribution).
For example, China’s remarkable growth over the period means that it comprised almost 40 percent of the lowest decile in 1988, but zero in 2008. At the other end of the distribution, the richest Chinese moved from their position between the sixty-fifth and seventieth global percentile in 1988, all the way up to the eighty-fifth percentile in 2008.
Figure 1. Growth rates across percentiles of the global income distribution, 1998-2008 (%)
Source: Lakner and Milanovich (2013).
More recent work by Milanovic (2022) has updated the global income distribution to 2008-2018. The more recent data suggests that the trend towards greater equality not only continued but gathered pace in the more recent period (Figure 2).
The highest income growth occurred among the world’s very poorest people, because of much higher-than-average growth rates in several countries with large numbers of poor people, including a number of countries in sub-Saharan Africa including Ghana, Kenya, Tanzania and Uganda, and among China’s rural population.
At the same time, the income growth rate of the very richest people in the world plummeted, completely eliminating the upturned trunk of the elephant in the original graph. This latter development occurred because of anaemic growth in some of the richest economies in the world after the Global Financial Crisis.
Just two countries – the United States and Germany – accounted for two-thirds of all people in the global top 1 percent, and both countries grew relatively slowly post-crisis, at or below about 2 percent per annum.
Figure 2. Growth rates across percentiles of the global income distribution, 2008-2018 (%)
Source: Milanovich (2022).
Data from the United Nation’s World Income Inequality Database corroborates the story (Figure 3). The Gini index is economists’ standard measure of inequality, measuring the extent to which a given society deviates from a condition of absolute equality where every member of society earns the same income.
The higher the Gini index, the less egalitarian a society. Computing the Gini index for the world as a whole shows a precipitous drop in inequality from the early 1990s onwards.
Figure 3. World Gini index, 1950-2020 (%)
Source: World Income Inequality Database (WIID).
The fundamental reason behind the drop in global inequality is the rapid economic rise of countries that used to have enormous numbers of poor people, relative to the mature economies of the West. Just two countries, China and India, accounted for about two-fifths of the world population in the 1980s; their progress relative to the West has been meteoric, more than offsetting any increase in domestic inequality within countries.
The Gini index cannot be decomposed into within-country and between-country components. But a related measure, the so-called Theil Index, can. Figure 4 shows that the big change since the 1980s is that between-country inequality has plunged, at a much faster rate than the relatively muted increase in within-country inequality.
Figure 4. Global inequality decomposed into within- and between-country inequality, 1980-2018 (Theil index)
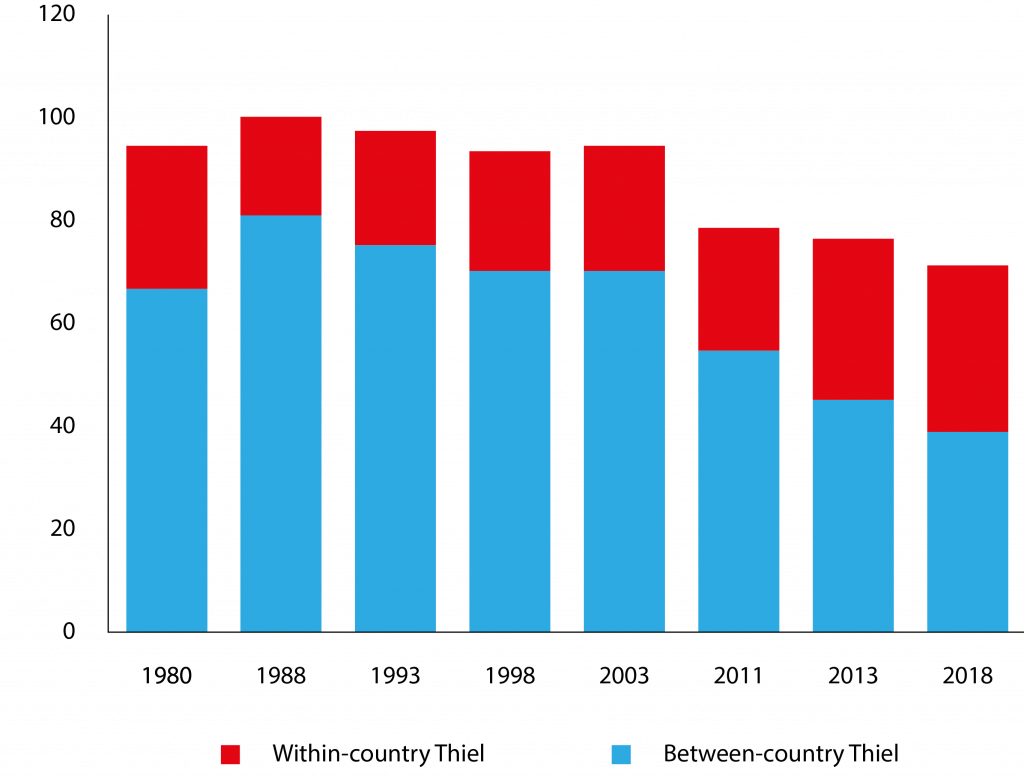
Source: Bruegel based on Milanovic (2022).
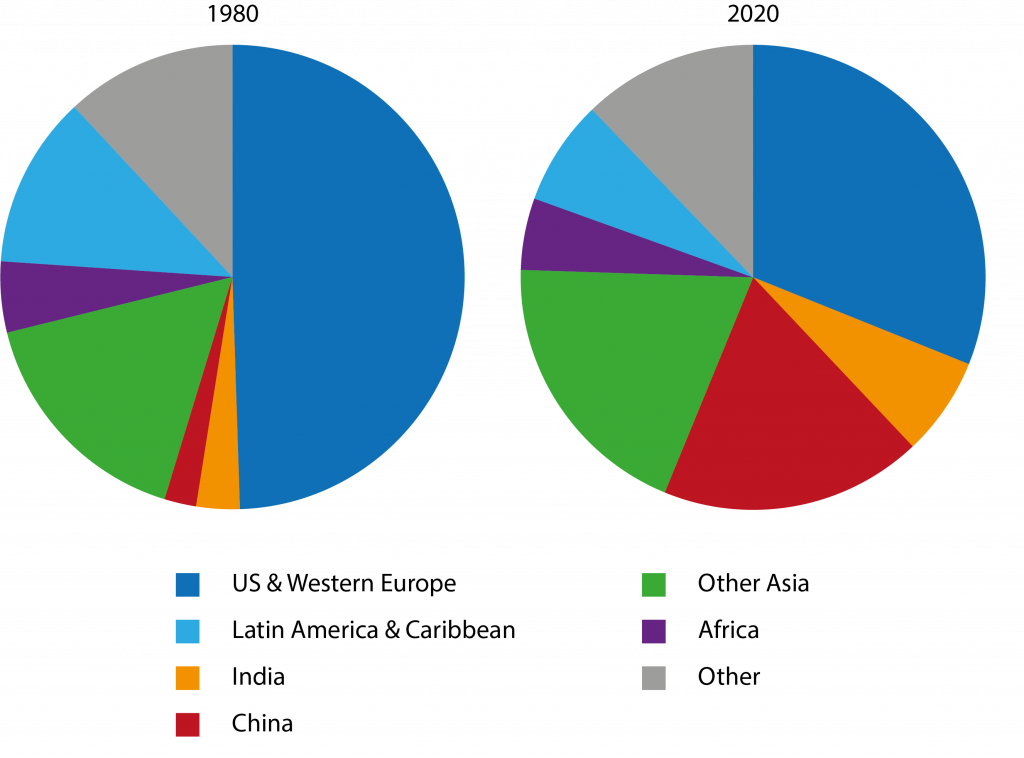
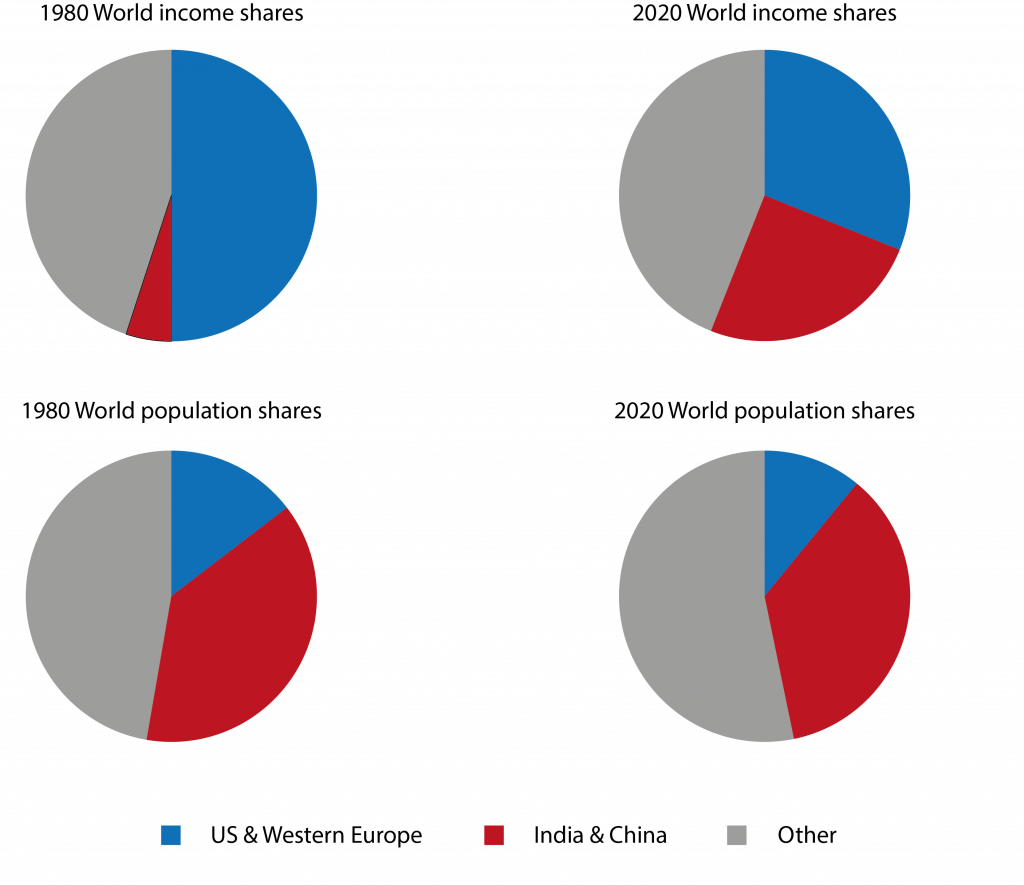
In fact, the headline story of the global income distribution is the rise of China, and, to a lesser extent and with a delay of a decade or so, India (Darvas, 2019; Dabrowski, 2019). In 1980 these two giants accounted for almost two- fifths of the global population but only about 5 percent of global income.
By contrast, the US and Western Europe accounted for under 15 percent of the global population but commanded a full half of global income. This extreme inequity has been reduced greatly, though by no means eradicated, over the last four decades (Figure 5). China and India together now account for roughly the same share of global income, measured in purchasing parity terms, as the Western countries.
This still leaves a substantial gap between average incomes in ‘Chindia’ and the West, since the latter still accounts for a much smaller share of the global population than the former, but the gap has been reduced substantially.
Figure 5. Evolution of world income distribution, 1980-2020 (%)
Note: Income shares based on purchasing power parities (PPP).
Source: Bruegel based on IMF, World Economic Outlook.
From a global perspective, this is the dominant theme of at least the last four decades. Other regions have waxed and waned in terms of their shares. For example, Latin America and the Caribbean have seen their share go down somewhat, while other Asian countries have seen their shares rise a little, but these are in the nature of footnotes to the grand redistribution of global income shares from the West to China and India.
This can be seen even more starkly by consolidating all the other regions in Figure 5 into a single category and looking at a version with just three segments (Figure 6). The West shrinks. Chindia expands. The rest stay more or less the same.
And all this occurs without major changes in the regional pattern of world population shares. Investigating the profound changes in China and India over the past half century is therefore key to understanding the evolution of the world income distribution.
Figure 6. Evolution of world income distribution, main blocs, 1980-2020 (%)
Note: Income shares based on purchasing power parities (PPP).
Source: Bruegel based on IMF, World Economic Outlook.
3 Chindia
China and India began liberalising their economies at slightly different times in the late twentieth century. In both cases, liberalisation was not a one-and-done event, but a process that waxed and waned, gaining speed at times and subsiding at others.
In China especially, economic governance under Xi Jinping is becoming more authoritarian in several areas, as part of a global turning away from liberal economic principles. Nonetheless, the overall trajectory over the last four to five decades has been unmistakable: a transformative change from central planning to market-based economic activity, from state ownership to private sector-led growth, and from near-autarky to broad and deep engagement with the world.
From the viewpoint of global economic welfare, the prolonged and fitful entry of China and India into the ranks of the liberal international economic order is probably the seminal shift of the twentieth century, of ultimately greater scope than other seismic events, such as the Great Depression, post-war reconstruction, the collapse of the Iron Curtain and the rise of the ‘Asian Tigers’.
Until well into the 1970s, both the Chinese and Indian economies were characterised by dominant roles for the state. China’s economy had been ravaged by two of Chairman Mao’s policy disasters. The Great Leap Forward, focusing on the collectivisation and industrialisation of the countryside, resulted in a famine that took the lives of more than 30 million people.
The Cultural Revolution turned society upside down, with ‘revisionists’, ‘rightists’ and ‘capitalist-loaders’ purged from the party, and vast numbers of intellectuals sent to re-education camps or sentenced to hard labour in the rural hinterland. There was no private industry to speak of.
In India, meanwhile, the ‘license-quota-permit Raj’2 governed every aspect of the economy. The commanding heights of the economy – vital industrial sectors such as steel, energy and mining – were reserved entirely for state-owned firms3. Soviet-style five-year plans sought to promote rapid industrialisation by channelling resources towards favoured sectors (Bhagwati and Chakravarty, 1969).
The mantra of import-substitution resulted in the world’s highest tariff rates, a host of inefficient domestic producers shielded from foreign com- petition and close to zero trade. At 8 rupees to the dollar, the exchange rate was massively overvalued, rendering exports uncompetitive.
Deng Xiaoping’s ‘Reform and Opening-Up’ aimed to heal the Chinese economy after the depredations of the Great Leap Forward and the Cultural Revolution. After cementing his role as Chairman Mao’s successor in 1978, Deng introduced wide-ranging market-oriented reforms. Land ownership was de-collectivised in the highly populated agricultural sector.
Under the new household-responsibility system, communes were divided into private plots and peasants were able to exercise formal control over their land, provided that they sold a specified portion of their crops to the government.
This was followed by industrial reforms to increase productivity. A dual-price system allowed state-owned enterprises to sell any production above the plan quota, and private companies were allowed to operate for the first time under Party rule.
Generally, these early reforms started with local experiments that were adopted and expanded elsewhere once their success had been demonstrated (Jin, 2023). Officials faced few penalties for experimenting and failing, and those who developed successful programmes received nationwide praise and recognition.
There needs to be a much greater focus on redistributing income, strengthening the social safety net and ensuring that economic opportunity is not an accident of birth
More ambitious reforms followed in the 1980s and 1990s, with many state-owned enterprises privatised or allowed to fail rather than kept afloat through state intervention. In order to increase labour productivity, the state allowed individual enterprises to introduce bonuses and to dismiss employees, rather than keeping them on to maintain full employment. The price mechanism was allowed to flourish in an ever-expanding sphere, starting with adjustments to the price of steel, a ubiquitous input for many products.
Domestic reforms were complemented by a broader opening-up to the world. Greatly influenced by the success of export-led development in Asian neighbours including Japan, Taiwan and South Korea, the state established a number of special economic zones (SEZs), characterised by much lighter regulation and much lower corporate tax rates (Keo, 2020).
These zones, especially the SEZ in Shenzhen, proved extremely successful in attracting foreign investment, initially from over- seas Chinese in Hong Kong and Taiwan, and later also from Japan and the US after the stabilisation of diplomatic relations with those countries. Meanwhile, protectionist barriers came down and tariffs were liberalised, culminating in China’s accession to the World Trade Organisation in 2001.
In India, the Rajiv Gandhi government introduced a number of liberalising reforms in the mid-1980s. Many categories of imported goods, including, crucially, several types of machinery and intermediate goods, no longer required licensing.
At the same time, the government’s monopoly over large classes of imports was reined in. Overall, the proportion of imports that could be imported without a license and was not reserved for the government shrunk from about 5 percent in 1980 to about 30 percent in 1987 (Pursell, 1992).
To incentivise exports, licenses were issued liberally for the import of capital goods, and these licenses could be traded on the market. At the same time, the first steps were taken to loosen the system of industrial licensing.
In 1985, 25 industries were released from licensing, the investment limit below which no license was required was substantially raised and automatic approvals were put in place for a range of capacity expansions by existing firms.
Much deeper reforms followed after India’s balance-of-payments crisis in 1991. Narasimha Rao’s technocratic finance minister, Manmohan Singh, swept away industrial licensing altogether, ushering in a fundamental change to India’s philosophy of economic governance.
Henceforth, rather than a baseline state of myriad industrial restrictions alleviated by a ‘positive list’ granting exemptions, the default shifted to an absence of restrictions unless specified in a ‘negative list’: loosely speaking, India shifted from a mindset of everything-that-is-not-specifically-allowed-is-forbidden to one of everything-that-is-not-specifically-forbidden-is-allowed.
Public-sector monopolies were swept away in most areas, with only a few security-sensitive sectors henceforth reserved for government-owned firms. Automatic approval was granted for foreign direct investment up to a 51 percent stake.
The same philosophy was applied to licensing for imports, which was abolished except for a negative list of imports still subject to restrictions. In 1991, license requirements were swept away for almost all machinery and intermediate inputs4. A dramatic reform of import tariff rates – which were the highest in the world – was also put in train. In 1991, the top tariff rate was 355 percent; this had fallen to 25 percent by 2003.
Finally, exchange controls were lifted in stages, allowing the rupee to move much closer to its market-determined rate over time and substantially alleviating the penalty to exporters from a structurally overvalued exchange rate.
In both China and India, liberalisation brought an increase in inequality. For both countries, the World Bank’s PovcalNet Database shows a rising Gini coefficient at the national level from the 1980s through the first decade of the twenty-first century, followed by a moderate decline dating from about the Global Financial Crisis (Figure 7).
The data should be interpreted with some care, since it pools together different vintages of household surveys, some of which cannot be easily compared with each other because of changing methodologies or coverage.
That said, the basic picture is clear, and is corroborated by several detailed studies: a sharp initial rise in inequality in China, followed by a mild decline, and a less pronounced version of the same developments in India (Bhagwati, 2011; Bhalla, 2011; Ahluwalia, 2011; Balas- ubramanian et al 2021; Jainchandra et al 2018; Kanbur et al 2017; Zhang and Li, 2016; Zhang et al 2011).
Figure 7. China and India, Gini coefficient
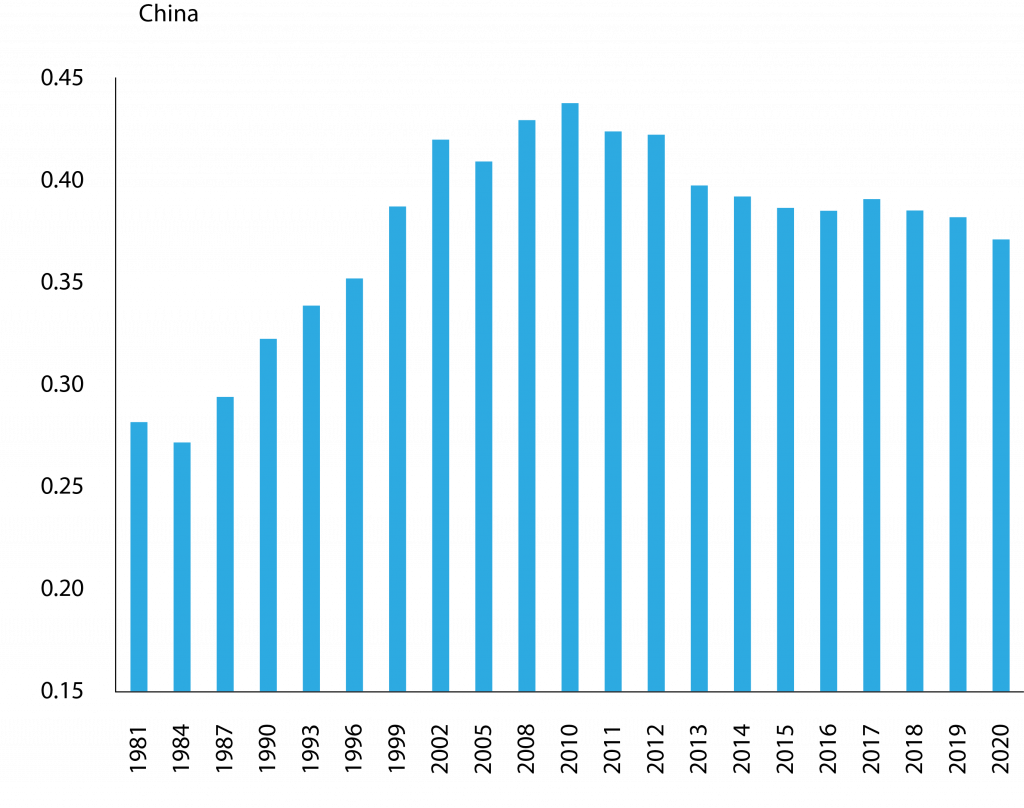
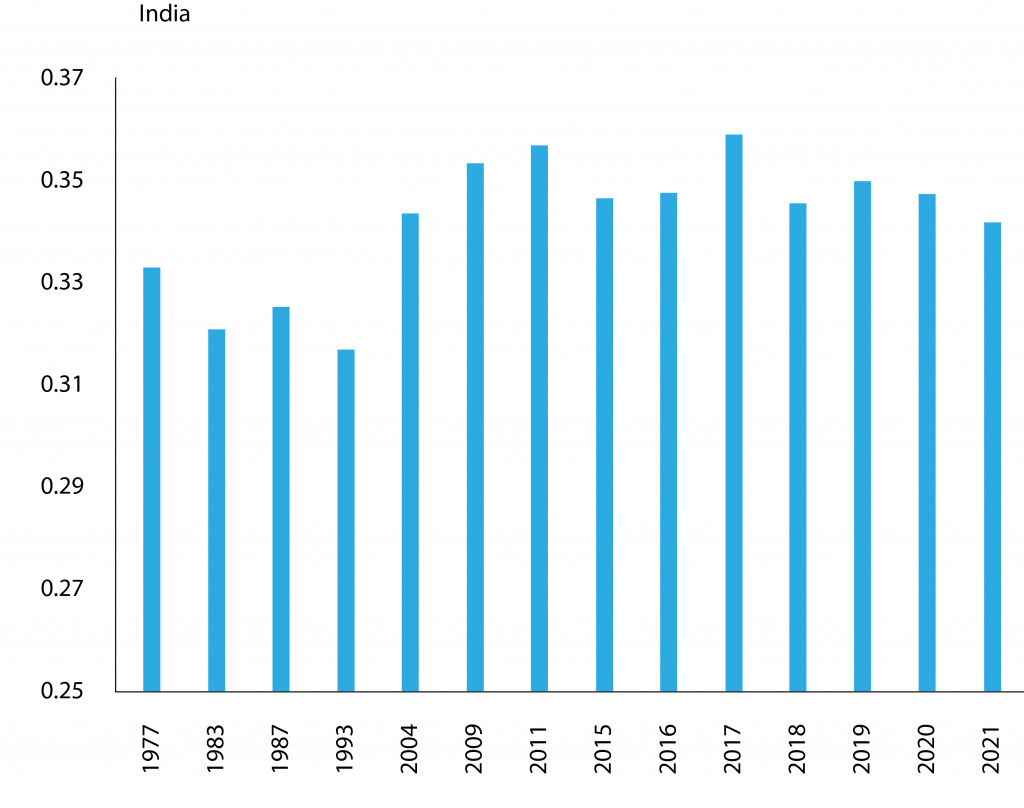
Source: Bruegel based on World Bank Poverty and Inequality Platform.
In China, a major reason for the rise in inequality during the first few decades of liberalisation lay in rapid urbanisation, in conjunction with a marked gap – common to most developing countries – between urban and rural incomes.
From earning about twice as much as the average rural household in 1980, the average urban household now earns about 3.5 times as much, and the urban population has increased greatly since the advent of China’s reforms, rising from about 18 percent of the total in 1976 to over 65 per- cent in 2022 (Piketty et al 2019).
Differences in educational attainment were another important driver of the rise in inequality, with the returns to higher education rising rapidly on the back of an increase in the demand for skilled labour (Dollar, 2007).
But both these factors appear to have run their course, contributing to the mild decline in income inequality observed since the late 2000s. The rural-urban income gap has been narrowing since 2007, likely because several decades of galloping urbanisation have reduced surplus labour in rural areas sufficiently to support rising wages. The skill premium has also been falling, possibly because of a glut of university graduates, many of whom find it difficult to obtain suitable employment.
The reversal could also be in part down to government policies explicitly geared towards reducing inequality, including higher minimum personal income tax thresholds, significant annual hikes to the minimum wage, public investment in rural infrastructure and the rapid expansion of medical coverage for rural residents.
In India, the increase in the Gini coefficient over the first few decades of liberalisation was much less sharp than in China, in line with the much slower pace of urbanisation. The proportion of city dwellers rose from a quarter of the total population in the mid-1980s to about 36 percent today. In stark contrast to China, the vast majority of Indians today still live in villages.
Nonetheless, the stronger growth impact of economic reforms in cities compared to villages was certainly an important driver of increasing inequality (Topalova, 2007). In addition, liberalisation tended to bring fewer benefits to initially less-affluent states, which typically had relatively inflexible labour markets that hindered geographical mobility, and less favourable demographic structures (Besley and Burgess, 2004; Topalova, 2007; Aiyar and Mody, 2013).
The subsequent decline in inequality over the last decade or so has also likely had several causes, including government policies including a massive rural employment guarantee scheme inaugurated in 2006 (currently the world’s largest public works programme), and the exhaustion of the demographic dividend – the bulge in the working age population – in some of India’s richer states (Deininger and Liu, 2013; Narayan, 2022; Aiyar and Mody, 2013)5.
But greater inequality since the dawn of liberalisation in India and China pales in significance compared to the trans- formative increases in material prosperity across the entire spectrum of the income distribution.
Both countries registered step-increases in GDP growth post-liberalisation compared to previous decades, sweeping away the entrenched fiction that only moderate rates of growth were possible for two such crowded, complex, poverty-stricken giants (Table 1 and Figure 8).
True, China’s success was preceded in East Asia by the Tiger economies of South Korea, Taiwan, Singapore and Hong Kong, but, with the possible exception of South Korea, these were all regarded as mini-economies that could achieve growth rates inaccessible to their colossal neighbour.
Meanwhile economist Raj Krishna’s famous phrase, the “Hindu rate of growth”, captured pithily the fatalistic sense that an economy of India’s size and diversity must plod along at an unambitious rate of growth, counting on time rather than speed for the achievement of prosperity.
Table 1. China and India, GDP growth rates per decade (%)
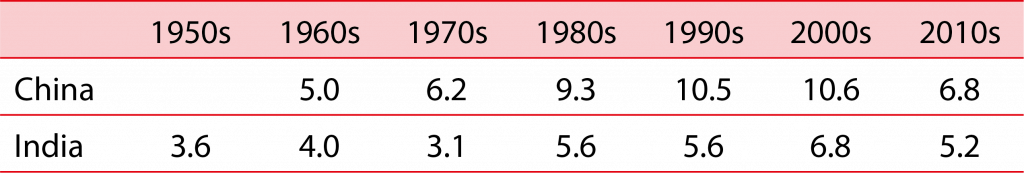
Note: Data for the 1950s covers 1951/52 to 1960/61.
Source: Bruegel based on World Development Indicators (WDI) and the Indian National Statistical Organisation.
Figure 8. China and India, GDP growth rates pre- and post-liberalisation
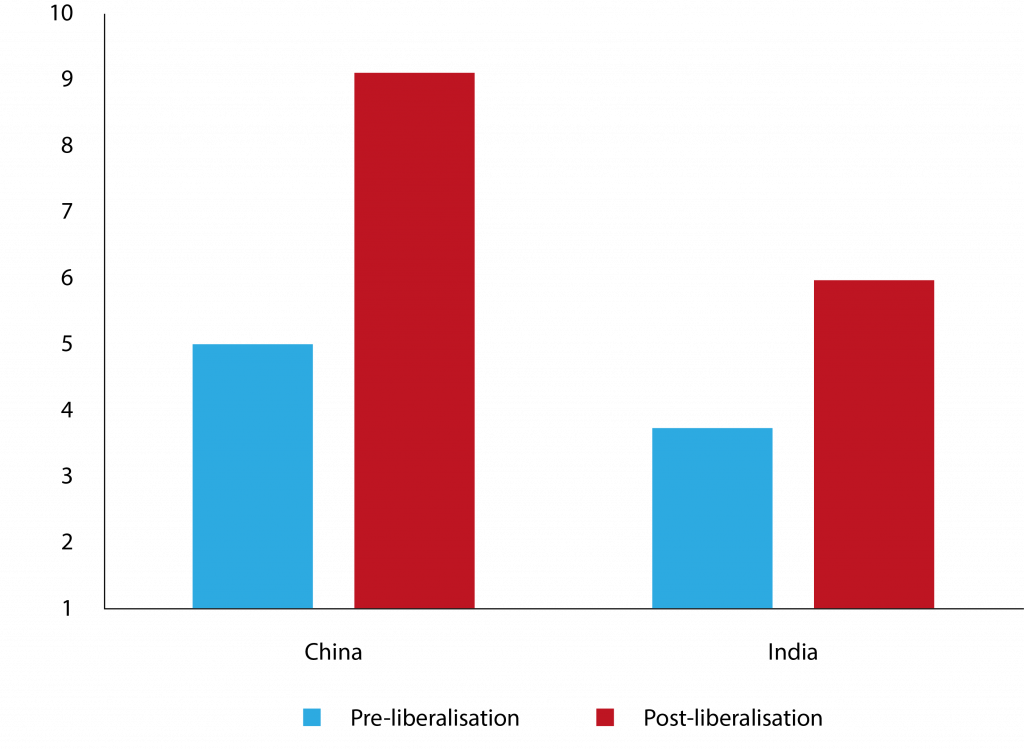
Note: ‘Pre-liberalisation’ is before 1978 for China and before 1984 for India.
Source: Bruegel based on World Development Indicators (WDI) and the Indian National Statistical Organisation.
The sharp rise in the GDP rate of growth in both countries after liberalisation has supercharged the pace at which the average person can expect to see life-changing improvements to their economic circumstances (Table 2). In both India and China, the number of years that it takes to double GDP fell precipitously following liberalisation.
Moreover, in both countries, there has also been a substantial (in China’s case spectacular) fall in the population growth rate, so the amount of time that it takes to double living standards has been cut even more steeply. In India, the number of years that it takes to double per-capita income has been cut from 46 pre-liberalisation to 17 post-liberalisation. In China the time has been cut from 26 years to a mere 9 years.
To put these numbers in perspective, by the time a child reaches the age of majority in India, she can expect twice the income that her parents earned when she was born. In China she can expect four times that amount.
Table 2. Time in years to double income, pre- and post-liberalisation
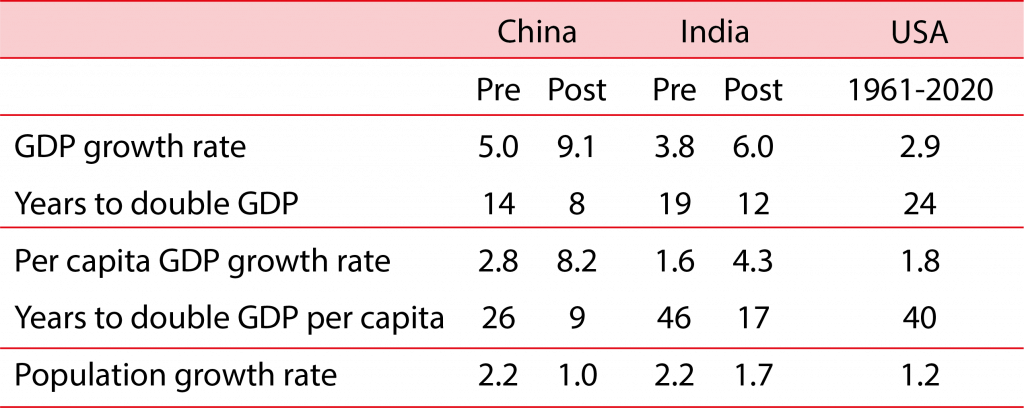
Note: ‘Pre-liberalisation’ is 1961-1977 for China and 1952-1983 for India. ‘Post-liberalisation’ is 1978-2020 for China and 1984-2020 for India.
Source: Bruegel based on WDI, Indian National Statistical Organisation, UN Population Prospects.
More importantly, these quantitatively higher rates of growth lifted all. Figure 9 shows the cumulative growth over the last four decades for each decile of the income distribution. Note first that in India, economic growth was rather evenly spread among deciles; every decile saw cumulative income growth of somewhere between 350 percent and 400 percent.
For the poorest decile, cumulative growth amounted to 354 percent, more than twice as rapid as income growth for the poorest global decile. So the poorest Indians saw their living standards improve much faster than the global poor. In fact, income growth for every Indian decile has outpaced its counterpart global decile since the 1980s.
Figure 9. Income growth by decile, China, India and the world, 1981-2022 (%, cumulative growth)
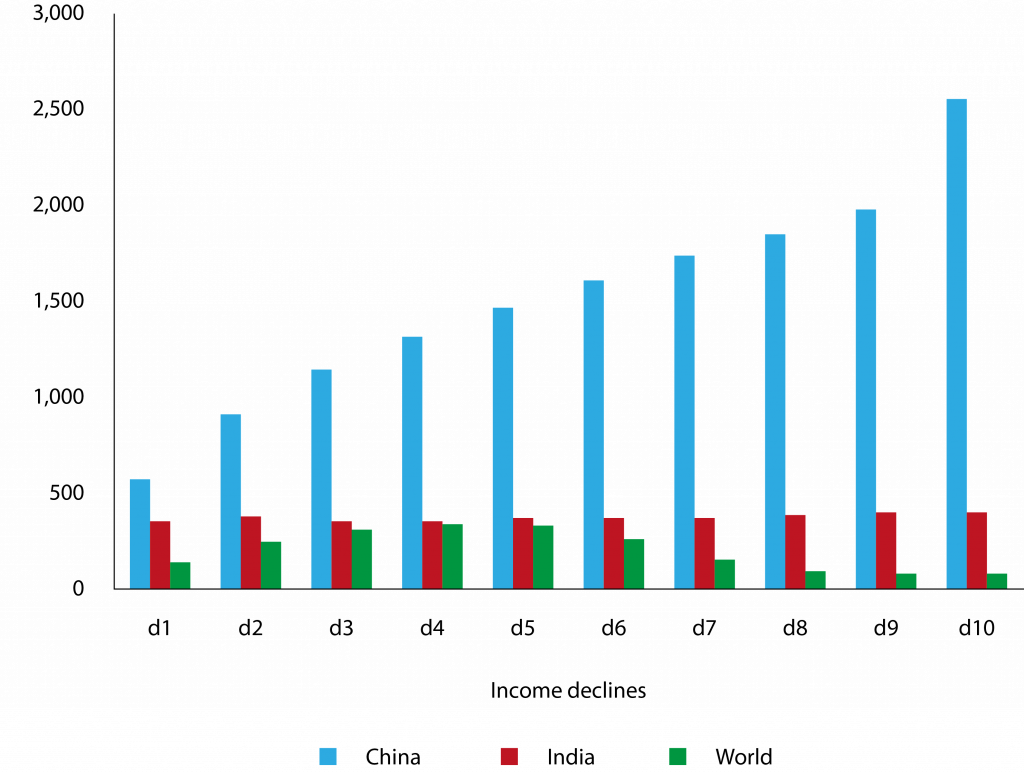
Note: for India is from 1983-2022.
Source: Bruegel based on World Income Inequality Database.
Impressive as this performance is, it has been put in the shade by China, where growth in every decile towered above its counterpart global decile, while also standing comfortably above its counterpart Indian decile. The distribution of growth was far less even across deciles than in India, with the richest decile growing by over 2500 percent.
But even the gains of the lowest decile, at about 574 percent, were striking in comparison to both India and the global average. Even if the poorest in China were increasing their incomes at a modest pace relative to the richest, they were nonetheless progressing much faster than those in the same decile elsewhere.
The pattern becomes even starker further up the distribution. For the fifth and sixth deciles, cumulative growth in China was more than four times the growth in India, and close to six times the global average. The rise in income inequality in China and India is therefore fundamentally different from that in the West, where real incomes have stagnated or grown very slowly for those at the bottom of the distribution.
The extraordinary impact of high rates of growth, shared by every decile of the population, is best seen in its impact on poverty. The World Bank defines absolute poverty as subsisting on less than $2.15 a day6. At this level of income, hunger or the shadow of hunger is an inescapable fact of life: to use the phraseology of the UN Food and Agriculture Organisation, it is challenging to obtain “a sufficient amount of calories on a regular basis to lead a normal, active and healthy life”7.
Malnutrition, disease and social exclusion are daily aspects of the lives of the truly poor. One could make a principled argument, based on diminishing marginal utility, that even small improvements to the material circumstances of somebody living in absolute poverty add more to human welfare than large improvements to the circumstances of those more fortunate.
The steep falls since liberalisation in the numbers of people living in absolute poverty in China and India – the so-called ‘poverty headcount’ – must count as one of the most sweeping and dramatic improvements in human welfare in the history of the world (Figure 10).
In China more than 90 percent of the population lived in absolute poverty in 1981; today the fraction is close to zero. In India the poverty headcount ratio declined from well above 60 percent in 1977 to a little above 10 percent today.
In absolute numbers, China reduced the number of poor people from about 847 million in 1983 to a margin-of-error 2 million in 2019. India reduced the number of poor people from 420 million in 1983 to 147 million today.
Together, the two countries were responsible for lifting an astonishing 1.1 billion people out of poverty over the last four decades. Since the number of global poor fell by about 1.3 billion over the period, China and India accounted for more than 85 percent of the reduction (Figure 11).
Figure 10. Poverty headcounts, China and India (%)
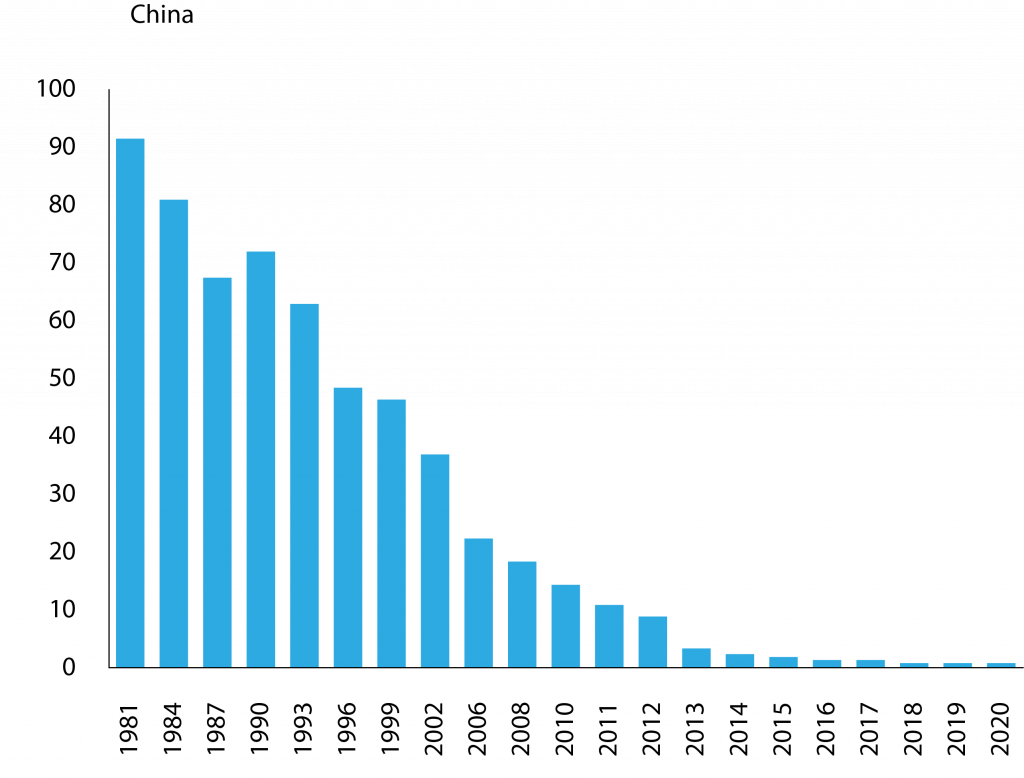
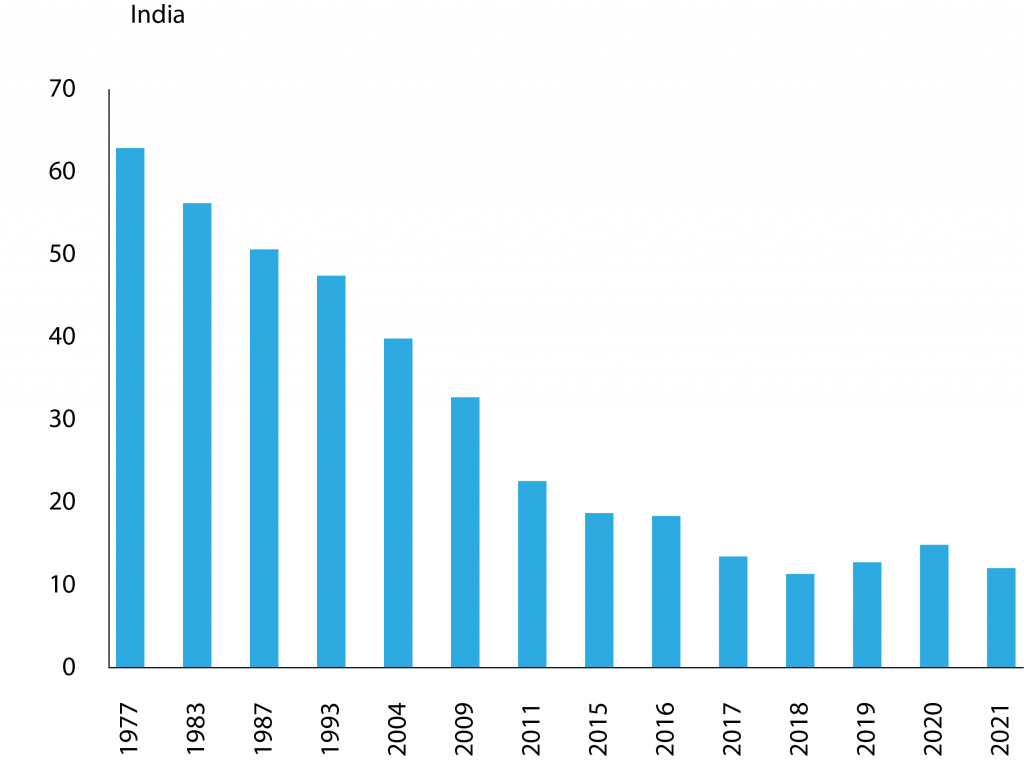
Note: % on less than $2.15/day, 2017 PPP.
Source: Bruegel based on World Bank World Development Indicators.
Figure 11. Global population living in absolute poverty (billion people)
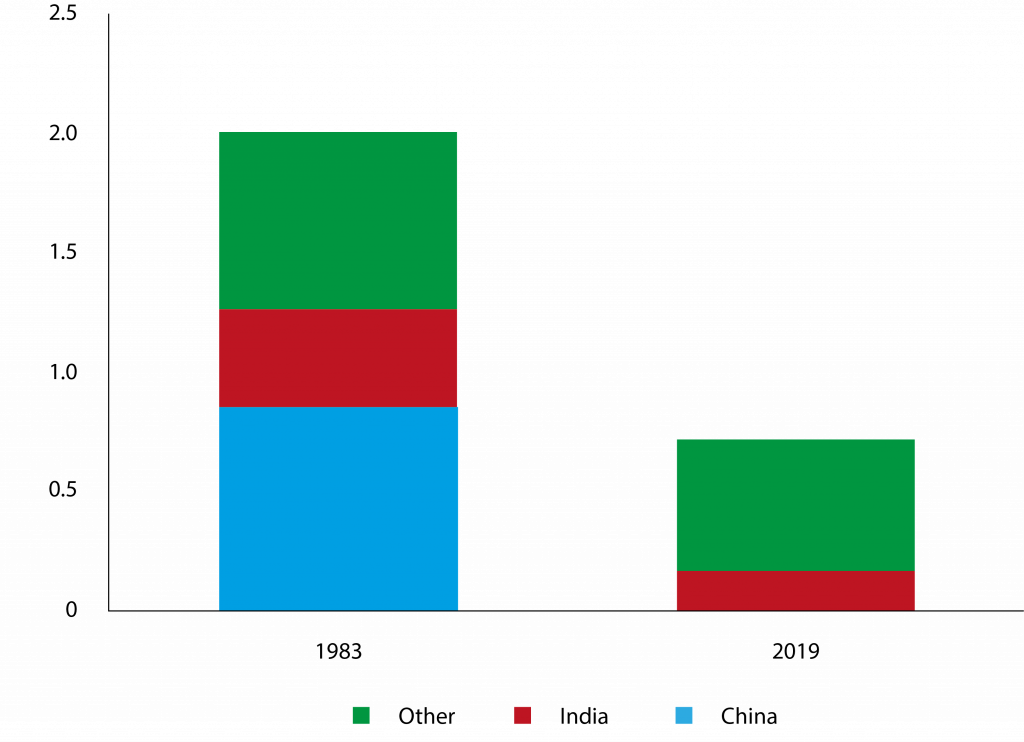
Source: Bruegel based on World Bank World Development Indicators.
4 Rich countries
Of course, rising within-country inequality is certainly a serious economic issue in several rich economies, so much so that it has come to dominate the political discourse. Several excellent popular works, such as Martin Wolf’s Crisis of Democratic Capitalism (2023) and Kimberley Clausing’s Open (2020), document this trend in empathetic detail.
In most Organisation for Economic Co-operation and Development (OECD) countries, the labour share of income has declined substantially in recent decades, suggesting that the gains from economic growth have accrued disproportionately to the owners of capital and to the highly educated (Figure 12).
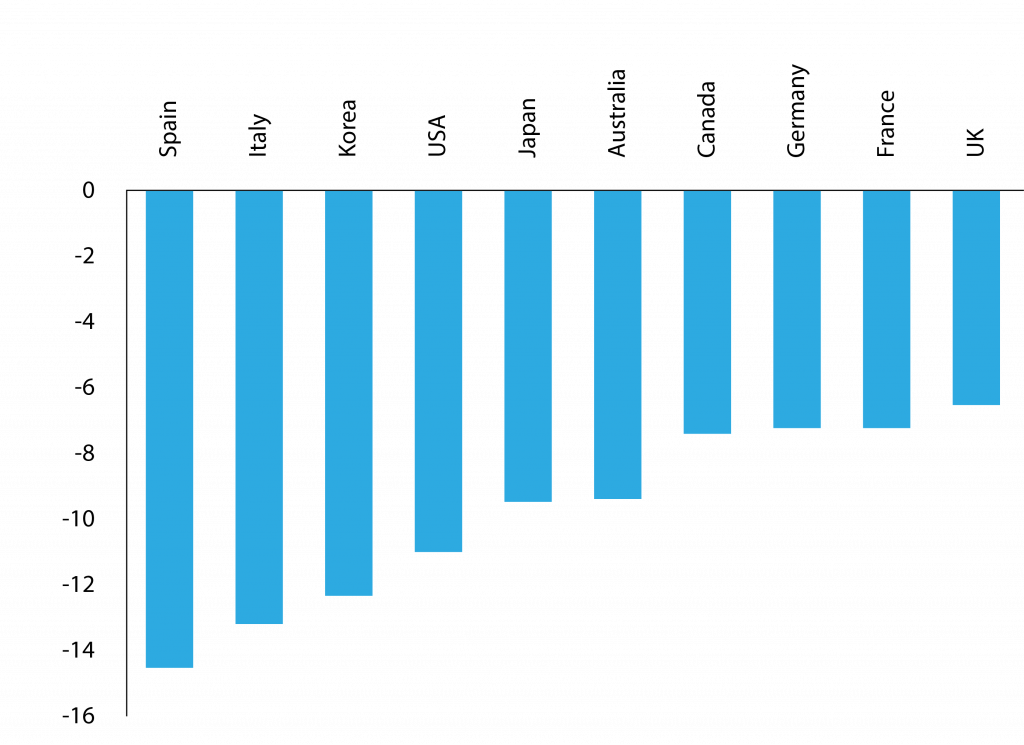
This creates a stark discrepancy between the rate of growth of the economy as a whole and that of the average person’s earnings. A vivid illustration is provided by the US, where GDP per capita more than doubled between 1984 and 2022, but median household income rose much more slowly (Figure 13).
The sense that every generation would inevitably do better their parents is being lost. The share of households with flat or falling real market incomes (ie. before redistribution) between 2000 and 2014 was a staggering 80 percent in the US, and more than 60 percent for a sample of rich countries (Figure 14).
Figure 12. Change in the labour share of income, 1970-2014 (%)
Source: Bruegel based on ILO and OECD (2015).
Figure 13. US household median income vs real GDP per capita, 1984-2022 (1984 = 100)
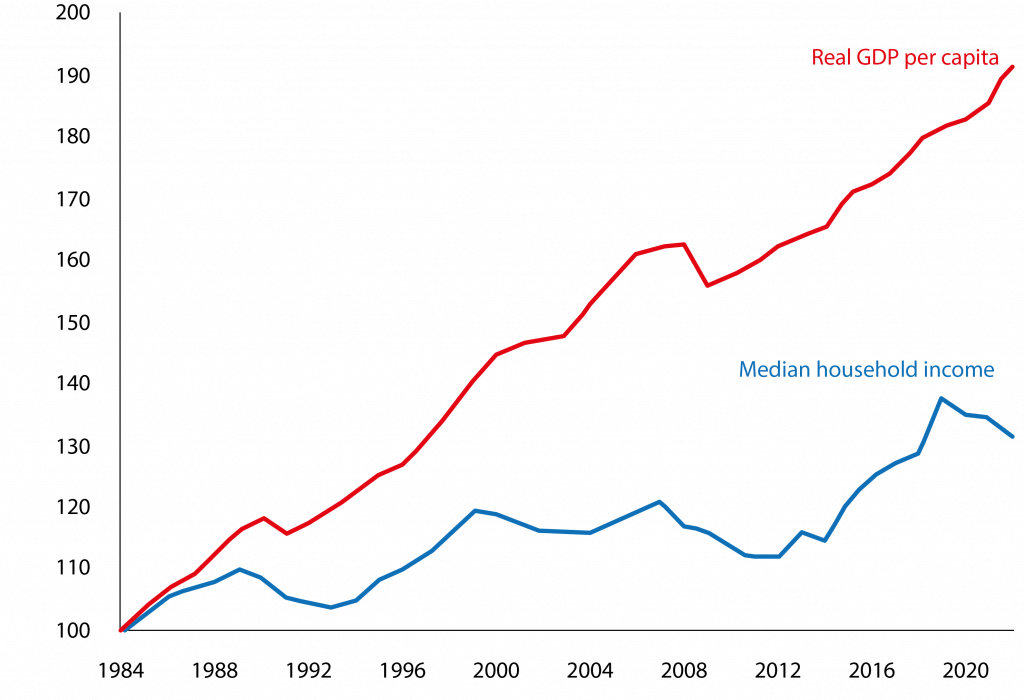
Source: Bruegel based on Federal Reserve Bank of St Louis.
Figure 14. Share of households with flat or falling real incomes, selected countries, 2000-2014 (%)
Note: Real market income from wages and capital.
Source: Bruegel based on McKinsey Global Institute.
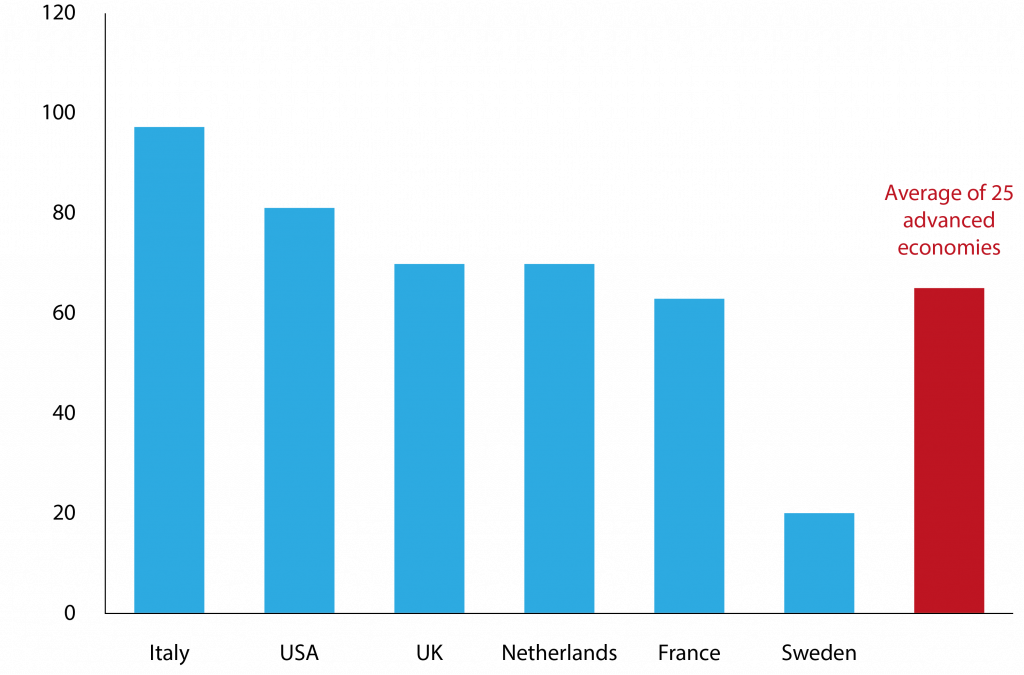
The situation is made worse by conspicuous gains for those at the top of the ladder, even as the middle-class stagnates. In the US in 1965, the average CEO earned about 21 times the compensation of a non-supervisory worker; by 2022 the multiple had skyrocketed to a jaw-dropping 344 (Bivens and Kandra, 2023).
Correspondingly, the fortunes of the top 1 percent have soared. The economists Thomas Piketty and Emmanuel Saez famously used data from income tax returns to estimate that the pre-tax share of the top 1 percent of US earners in national income more than doubled between 1979 and 2019, rising from about 9 percent to 19.4 percent (Piketty and Saez, 2013)8.
These estimates have been challenged and refined by other economists, most notably by Gerald Auten and David Splinter, who correct for factors such as different divorce rates between rich and poor households, and a major reform to the US tax regime in 1986 (Auten and Splinter, 2023).
They found a more modest rise in the share of the top earners, from about 9.4 percent in 1979 to 13.8 percent in 2019. Whatever the exact numbers, the sense of an unequal distribution getting more unequal over time persists (Figure 15).
Figure 15. Share of US national income accruing to top 1%, 1960-2019
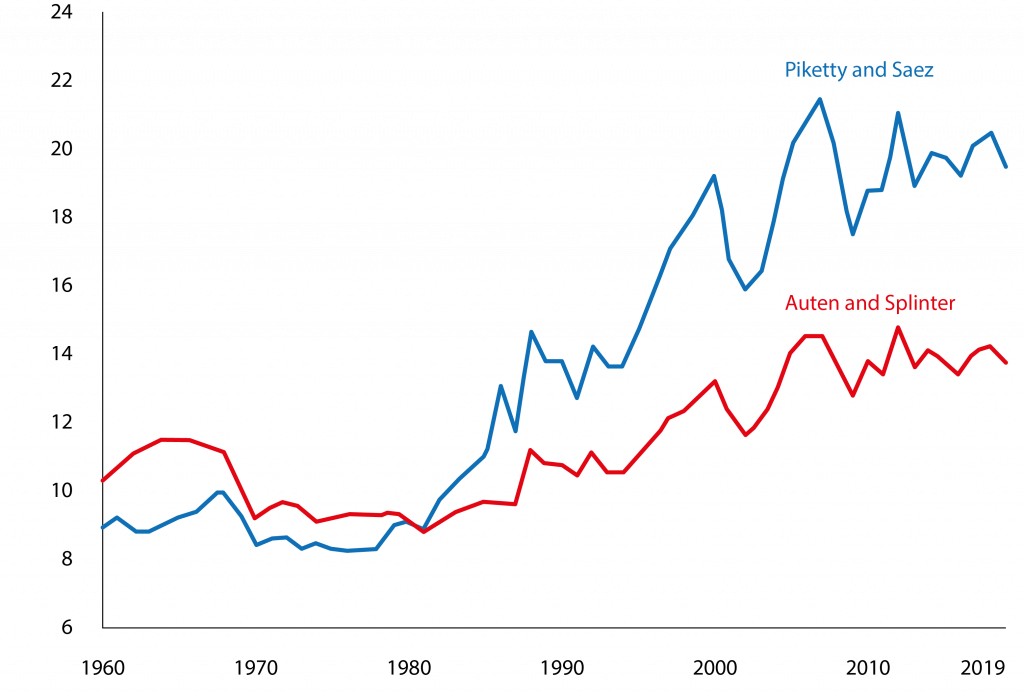
Source: Bruegel based on Piketty and Saez (2023) and updates; Auten and Splinter (2023).
Even more concerning to a liberal, inequality of opportunity is unacceptably high. Economists measure inequality of opportunity by looking at the correlation between the lifetime incomes of parents and the lifetime incomes of their children.
If the opportunities available to the children of the affluent and the destitute were identical, this correlation – called the inter-generational elasticity, or IGE – should be close to zero. Unsurprisingly this utopian condition does not prevail anywhere in the world.
Generally speaking, IGE tends to be higher, that is to say, inequality of opportunity tends to be more entrenched, in poor countries than in rich countries, a relationship dubbed the ‘Great Gatsby Curve’ (Krueger, 2012).
This makes sense: poor countries typically have more rigid class structures, with greater educational variation by income, leakier social safety nets and relatively few opportunities to transcend one’s childhood background.
But IGE is also high in OECD countries. In the US, for example, research suggests that the IGE of income could be as high as 0.6 (Mazumder, 2005). At that level of IGE it would take, on average, five to six generations, or more than a hundred years, for descendants of a family living at the Federal poverty line to come within 5 percent of the average national income.
Contrary to the cherished mythology of the American Dream, the children of low-income parents clearly do not have access to remotely the same opportunities as the children of the more affluent.
Not only is inequality of opportunity self-evidently unjust, it also amplifies and extends the malign effects of inequality of outcomes. In societies where opportunity is unequally distributed – where the material circumstances of parents act as binding constraints on the opportunities available to their children – unequal outcomes exert a greater drag on economic growth (Aiyar and Ebeke, 2020).
Any increase in income inequality tends to become entrenched, limiting the investment opportunities – broadly defined to include investment in children – available to low-income earners, thereby retarding aggregate long-run growth.
By contrast, in societies with more equal distributions of opportunities, an increase in income inequality can be more easily reversed and need not constrain investment opportunities and growth (Figure 16).
Figure 16. Income inequality and long-run growth (1970-2015)
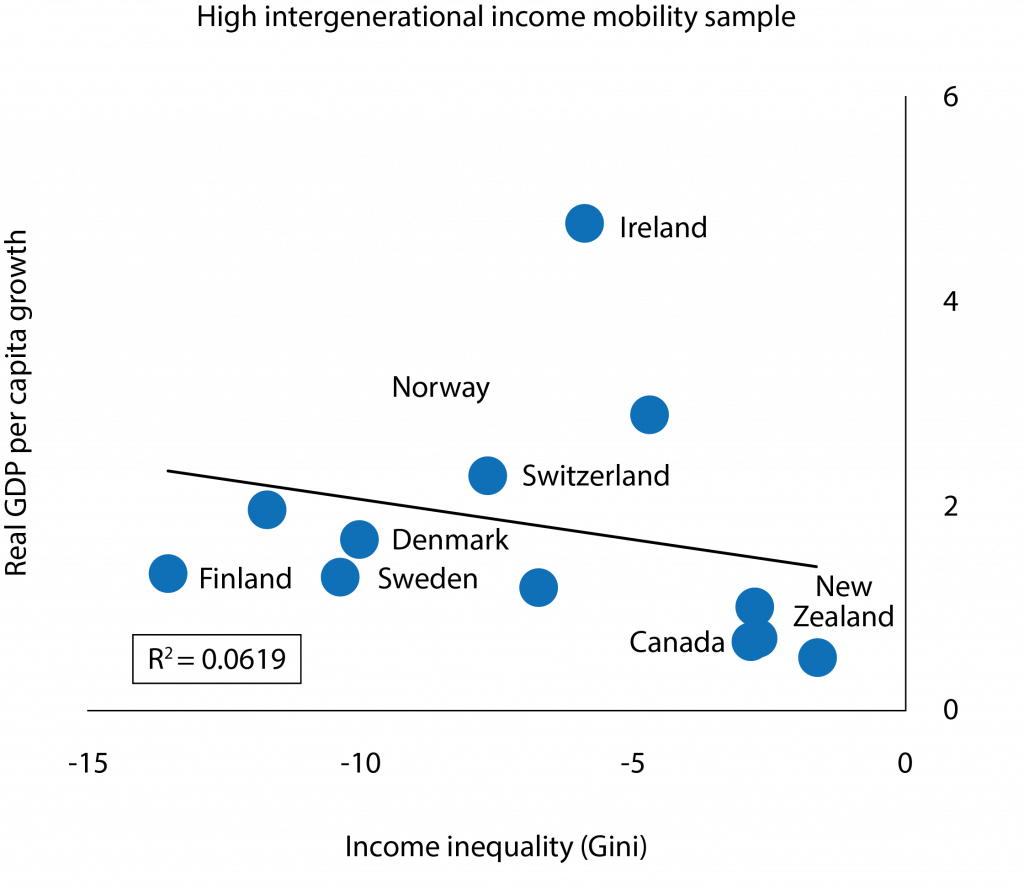
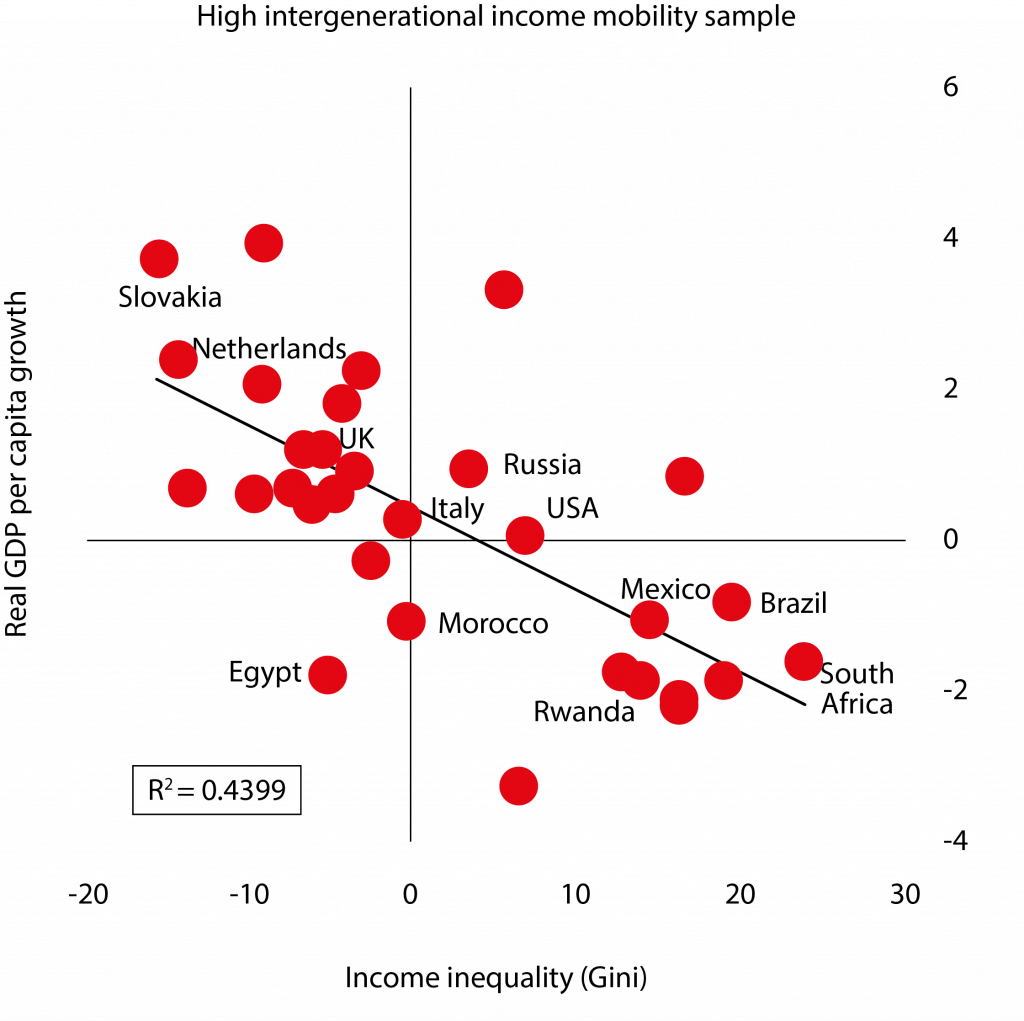
Source: Aiyar and Ebeke (2019). Notes: The scatter plots show the residuals of both real per-capita growth and the income Gini derived from fixed effects regressions using five-year average data for a large set of countries over 1970–2015. The controls include the lagged levels of real GDP per-capita, the domestic investment rate, level of education and trade openness. The regressions also control for period fixed effects. The cut-off for intergenerational mobility into high and low samples is set at the value 0.3, which is the endogenously-determined threshold from the full-fledged non-linear estimations in Aiyar and Ebeke (2020).
Clearly, then, these concerns about inequality of income and inequality of opportunity are far from trivial. They are profound and deeply connected to ideas about what constitutes a just ordering of society. But their remedy does not lie in dismantling any of the foundation stones of the liberal international economic order. There is no need for greater state intervention in economic activity, for curbs on immigration, or for the protection of favoured domestic firms from international competition.
Instead, the remedy lies in much greater income redistribution and high-quality provision of public goods, both to strengthen the social safety net and, more importantly, to move in the direction of more-equal life opportunities. For example, differences in school quality and nutrition early in life can have career-determining consequences.
To a liberal it is therefore of first-order importance to reduce these differences to the maximum extent possible, as part of what Nobel Laureate Angus Deaton (2023) called ‘pre-distribution’. A much greater effort at establishing universal access to basic goods, combined with more generous income redistribution, is perfectly compatible with the liberal economic order and would greatly strengthen its foundations.
There are many excellent policy ideas for strengthening the social safety net and moving in the direction of equalising opportunities. More importantly, rich countries today have historically unprecedented financial resources with which to fund these proposals.
One idea that seems radical at first blush but requires only the requisite political will, is that of a universal basic income (UBI). Granting every citizen a minimum income, irrespective of job status or any other conditions, would comprise the ultimate social safety net.
And while no policy action could conceivably level the playing field for children by granting them all equally well-resourced and responsible parents, a UBI could at least shield every child from the tragedy of a truly destitute parent.
Many varieties of UBI could be considered, with hugely different price tags. Consider, as a baseline, a proposal by the legal scholars Miranda Fleischer and Daniel Hemel to provide a UBI of $500 per month to every adult and every child in the US (Fleischer and Hemmel, 2020).
This level of income corresponds to roughly half of the federally defined poverty line and is sometimes referred to as the ‘deep poverty’ threshold. By construction, therefore, the proposal would eliminate deep poverty, a condition currently endured by an estimated 12 million adults and 6 million children (Fox and Pacas, 2018).
The cost of the proposal would be roughly 9 percent of GDP, or 7 percent if the UBI were accompanied by the scrapping of a plethora of federally-funded transfer programmes, including food and rental assistance for low-income people.
The cost is clearly substantial but adding it in full to the current level of US general government expenditure of about 45 percent of GDP would still leave public spending about in line with Germany, and comfortably below the level in several other rich countries, including France, Italy, Austria and Belgium9. Note too, that the proposal’s price tag could be (modestly) reduced by deviating from a ‘pure’ UBI and phasing out the transfer beyond a certain income threshold10.
Critics often argue that the unconditional nature of UBI transfers will lead to poor spending choices by recipients that will degrade their quality of life over time: they will buy liquor, not food, they will gamble not invest. But quite apart from the questionable paternalistic premise that the critic knows better than the income recipient what is actually good for her, there is broad empirical evidence that unconditional transfers improve welfare over time.
In the US, studies have found that cash transfers are associated with improvements in infant health, additional years of schooling, increased test scores among students, and a lower rate of teenage arrests (Hoynes et al 2015; Dahl and Lochner, 2017; Akee et al 2010). These are precisely the kinds of indicators that one would use to measure whether early-life opportunities are being equalised.
In developing countries, studies have found that cash transfers lead to increased spending on food, education and medical care, and on capital investments such as acquiring livestock. There is little evidence of increased spending on ‘vice goods’, such as alcohol, tobacco or gambling.
The COVID-19 pandemic provided an interesting natural experiment on the impact of a sharp increase in unconditional transfers. The US Child Tax Credit was temporarily expanded to make the full credit available to low-income families that are usually excluded from coverage11.
The results were dramatic, with the child poverty rate falling from 9.7 percent in 2020 to a record low of 5.2 percent in 2021 (Jarrow, 2023). Moreover, this occurred without any measurable negative impact on employment among recipient families (Fenton, 2023).
Tragically, the expansion of the tax credit was rescinded as the pandemic waned, resulting in a swift rebound of child poverty to 12.4 percent in 2022, the steepest one-year rise in child poverty in recorded history.
Given that the cost of reinstating the full credit is estimated at a mere $12 billion per annum, or about 0.05 percent of US GDP, the liberal case for doing so immediately would seem unassailable by any moral or practical calculus (Joint Committee on Taxation, 2021).
Short of a UBI, much can be done to improve the functioning of labour markets to strike an optimal balance between efficiency, job security and adequate compensation. A combination of employment-linked tax credits, publicly-subsidised childcare for working parents and generous unemployment insurance could in principle offer all workers an adequate income to participate fully in society.
The Danish system of ‘flexicurity’ has many of these features, aspiring to combine sufficient job security with the flexibility for employers to adjust their workforces in line with changing economic conditions (European Commission, 2007). When recession strikes – as it inevitably must – active labour market policies such as retraining and job-search assistance are essential to offer some degree of protection to workers.
Even with the most expert macroeconomic management, every so often there will occur a major economic disruption, with the potential to create mass unemployment and a downward spiral of declining demand and falling output.
The Global Financial Crisis and the COVID-19 pandemic provided examples from just the last couple of decades. In such episodes, prolonged layoffs can lead to the depreciation of workers’ skills, posing additional barriers to re-entry into the labour force (Suphaphiphat and Shi, 2022). This is especially true for a spell of unemployment early in one’s career, which can have lifelong effects (Yagan, 2019).
To cope with such large adverse labour-market shocks it is worth exploring innovative policy ideas that deviate from unemployment insurance. In particular, many European countries operate short-time work (STW) schemes, which subsidise firms to keep on their workers – typically on reduced hours – rather than firing them during a recession.
This enables the job match – the fit between the technical requirements of a job and the skills and experience of the worker currently employed in that position – to survive the downturn in market demand. Not only does this avoid the deterioration in worker skills, it also eliminates, in principle, costly post-recession searches for new workers by firms and for new jobs by workers.
Germany’s venerable Kurzabeit scheme, first conceived in the Weimar Republic but thoroughly updated and modernised in subsequent decades, is the paradigmatic example of a successful European STW. In the trough of the COVID-19 recession, with the parameters of the Kurzabeit programme having been adjusted temporarily to make payouts more generous and easier to access, unemployment in Germany rose by only 1 percentage point, compared to a rise in unemployment of almost 10 percentage points in the US, despite a GDP contraction that was slightly higher in Germany (Figures 17 and 18).
Moreover, the evidence suggests that, subject to getting various other policies correct, the careful use of STWs is not associated with more rigid labour markets and misallocated resources, contrary to oft-expressed concerns about the application of such schemes.
Figure 17. Germany vs US, change in unemployment rate (%, from Q4 2019)
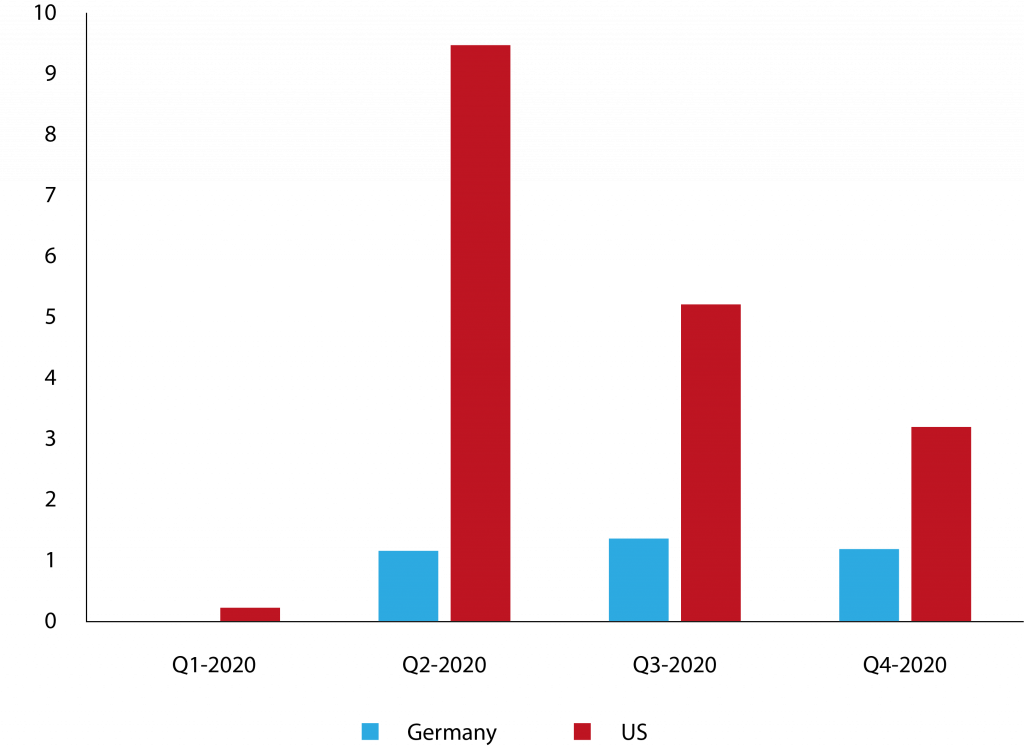
Source: Aiyar and Dao (2021).
Figure 18. Germany vs US, change in real GDP (%, from Q4 2019)
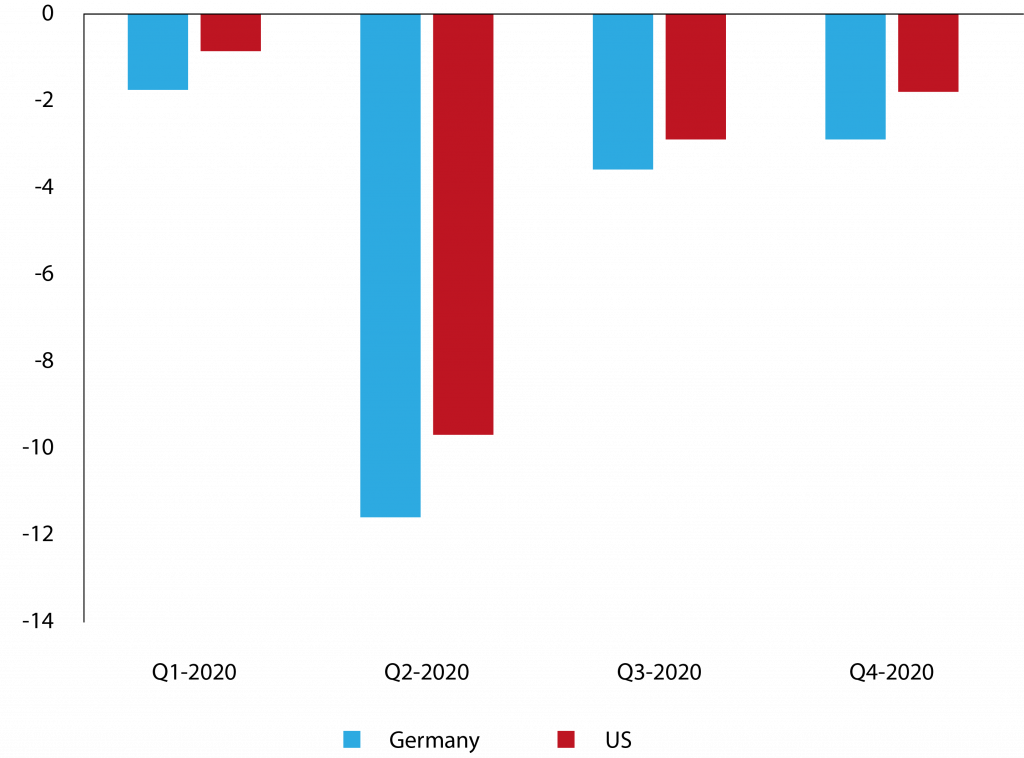
Source: Aiyar and Dao (2021).
Ultimately there is no shortage of policy ideas to ameliorate the unacceptably high levels of inequality in rich countries, which are rich not just relative to other countries in the world today but relative to any nation, tribe or empire in recorded history.
The resources with which to cushion the less fortunate and move in the direction of equalising opportunities for all members of society are unprecedented. Trying to put these ideas into action is not only compatible with the liberal economic order, but should be properly regarded as philosophically inseparable from it.
5 Evaluating global welfare
From a global perspective, the dominant public discourse about liberalism’s malign impact on economic inequality is alarmingly blinkered. The sharp rise of within-country inequality in rich countries needs urgent remedy, but applies to a set of countries that constitutes only about one-fifth of the global population.
The swift and broadly-shared rise in affluence of two late liberalisers, China and India – which together comprise about twice the population of the West – is far more important quantitatively. Inequality is rising only if one consciously restricts attention to the domestic income distribution of advanced economies, placing zero weight on other individuals outside those economies.
While such a focus may be important in explaining domestic political sentiment within rich countries, it is incompatible with a welfare assessment that treats equally every individual regardless of location.
The American philosopher John Rawls (1971) famously constructed a thought experiment to determine which of two states of the world is ‘better’, when each of those states features multiple people with multi-dimensional preferences. Let’s call one possible state of the world Eden and the other Swarga. Some people are happier in Eden because, say, they have a higher income and a more privileged societal position in Eden than in Swarga.
Others fare better in Swarga than in Eden. On what grounds might such inter-personal disagreements about desirable states of the world be mediated? How can an objective determination be made whether Eden is better than Swarga or vice-versa?
Rawls’s solution was to imagine a ‘veil of ignorance’ behind which a hypothetical observer – a prospective member of society – is situated. The observer is completely ignorant of their own attributes. They do not know if they are rich or poor, young or old, female or male, educated or illiterate.
They can observe every detail of life in Swarga and Eden but have no prior information about what their position in either society would be. From behind the veil of ignorance, which society would they choose to live in? Their choice defines what is meant by the ‘better’ society.
To bring this thought experiment to bear on the debate about liberalism, let’s say that Eden represents the world of about fifty years ago, pre-dating both the rise in Western with- in-country inequality and the liberalising reforms of China and India. Swarga represents today’s world.
From behind the Rawlsian veil of ignorance it seems indubitable that an observer would choose Swarga over Eden. Most obviously, the observer would have about a two-thirds chance of being Indian or Chinese, and their likely prospects as a randomly selected member of either of those two societies today will be vastly superior to those prospects in 1970.
This raw probabilistic calculation should substantively overwhelm any intuition about whether it is better to be, say, a randomly selected American citizen today versus half a century ago. After all, the chance of being an American in either of the two states of the world is comparatively minuscule, at less than one-twentieth.
A conceptually different way of choosing between states of the world was provided by the Italian polymath Vilfredo Pareto (Cirillo, 1979). By the Pareto criterion, a state of the world is superior to another if at least one person is better off, and nobody is worse off. Due to the second stipulation, this criterion is much stricter than almost any other way of ranking societies.
Even if 99 people prefer Swarga to Eden we cannot say that it is the better society so long as there is a single holdout who prefers Eden to Swarga. But a looser, more practical application of the principle would suggest that a society is better than another if a large majority of people prefers it, even if a small minority does not.
Such a modified Pareto criterion would be one way to put flesh on the bones of the stirring but vague utilitarian dictum to seek the greatest good for the greatest number12.
A sufficiently loosened Pareto criterion would also rank the world today as far superior to the world that existed half a century ago. Not only would there be unambiguous and widely shared gains in India and China, but there would also be substantial but less equally shared gains in more thinly populated parts of the world, including the West.
However, there would certainly be a minority of the global population – especially in the West – that has lost relative income and status, and which thus prefers the old world.
In a sense both the Rawlsian criterion and the modified Pareto criterion take us back to the elephant graph presented at the very beginning of this essay. There is a segment of the global population situated between approximately the seventy-fifth to the ninety-fifth percentile of the starting income distribution, comprising mainly blue-collar workers in rich countries, that has seen relative losses in recent decades.
But a vastly larger group of vastly poorer people has seen enormous gains. If you did not know, from behind the veil of ignorance, where in the distribution you were situated, you would certainly want to be born into the present not the past.
Similarly, if you were willing to loosen the strict Pareto criterion sufficiently to allow a roughly 80 percent majority to carry the day, then you would again prefer unambiguously the present to the past.
Of course, all politics are ultimately local. It is utterly rational for politicians to focus on what is good or bad for the populations of their own countries or even just their own constituencies, without too much regard for the impact of their policies on far-flung corners of the world. Indeed, one could argue that not caring more about the specific set of people that you represent would constitute political malfeasance.
But it is not clear that this courtesy should be extended to the broader intellectual class, widely defined to include academics, journalists, television pundits, professionals and policy analysts: all those who shape the Western (and therefore the global) public discourse.
These are people who would very likely profess to being universalists, holding dear the principle that the Gurugram call-centre operator and the Pittsburgh steelworker have equal human worth. They would view as an equal abomination a malnourished child in Hebei and a malnourished child in Hamburg.
For the intellectuals in these ranks, making welfare evaluations is necessarily more complex than simply surveying one’s backyard. Yes, blue-collar workers in rich countries have fared relatively poorly over the last several decades, and many policy changes are needed to remedy this.
But such policy changes are well within reach in the richest countries in the history of the world and require no fundamental transformation of the system that delivered this unprecedented affluence. Instead, there needs to be a much greater focus on redistributing income, strengthening the social safety net and ensuring that economic opportunity is not an accident of birth.
Above all, it is essential to recognise that focusing on one thin sliver of the global population is a singularly parochial way to judge the success of the liberal international economic order, under which much larger groups have begun to emerge from much more desperate circumstances. From behind the veil of ignorance things look better than ever before, even if they could always look better still.
Endnotes
1. Lakner and Milanovic (2013). Coverage ranges from countries representing 81 percent of the world population in the benchmark year 1988 to 94 percent in the benchmark year 2003; and from countries representing 91 percent of the world population in 1988 to 96 percent in 2003.
2. A phrase coined by India’s last Governor-General, Rajaji.
3. Originally coined by Lenin, the phrase “commanding heights of the economy” was popularised by the fervent revolutionary economist Yevgeni Preobrazhensky, who advocated state control of heavy industries to spur the rapid industrialisation of Russia’s economy.
4. However, consumer goods still remained under licensing; it was only in 2001, after a successful challenge at the World Trade Organisation, that these goods were removed from licensing requirements.
5. Apart from the sheer scale of India’s National Rural Employment Guarantee Scheme (NREGS), its design and implementation contain several features conducive to greater income equality. As pointed out by Narayan (2022), more than half of the workers employed under NREGS are women, a far higher proportion than in the regular labour market. NREGS stipulates equal payment for men and women, whereas in agricultural markets, wages are typically substantially higher for men. Moreover, NREGS employment among the poorest and socially marginalised communities – Dalits and Adivasis – is much higher than their proportion in the population.
6. A global poverty line of $1 a day in purchasing power parity (PPP) terms was first proposed in the World Bank’s World Development Report of 1990. It captured in an easy to understand and internationally comparable number the concept of living at or near subsistence. Subsequently there have been several updates to the line based on differential rates of inflation across countries and refinements to cross-country comparisons of minimum consumption levels. The updates include a threshold of $1.25 per day (based on 2005 PPPs) introduced in 2009, $1.90 a day (based on 2011 PPPs) introduced in 2015, and the current $2.15 a day (based on 2017 PPPs). See Ravallion (2010) for a good over- view, and for an explanation of the latest threshold at time of writing, Samuel Kofi Tetteh Baah, Aziz Atamanov, Dean Mitchell Jolliffe, Christoph Lakner and Daniel Gerszon Mahler, ‘Updating the international poverty line with the 2017 PPPs’, World Bank Blogs, 2 May 2022.
7. See FAO, ‘Hunger and food insecurity’.
8. Updated estimates available at Emmanuel Saez (berkeley.edu).
9. See OECD Data, ‘General government spending’.
10. Formally, a UBI that phases-out beyond a certain threshold is identical to a UBI with no phase-out but with an equivalent income tax imposed on those beyond the income threshold. In turn, these proposals are formally identical to a ‘negative’ income tax. Despite the equivalence of the proposals, the precise framing might well make a difference to the political acceptability of the idea.
11. The conventional child tax credit incorporates an income threshold of $2,500 per annum below which the credit is not paid. The threshold effectively screens out unemployed adults with zero income. An estimated 19 million children live in families that earn too little to receive the full credit.
12. Suppose that Eden comprises 99 individuals with zero income, and one individual who commands the entire GDP of society. Swarga has the same aggregate GDP but it is equally shared by all 100 members of society. Most people would have a strong intuition that Swarga is a better society than Eden, but the strict Pareto principle would not allow such an assessment. However, a looser Pareto criterion, and of course the Rawlsian test, would allow an unambiguous ranking of Swarga as the more just society.
References
Ahluwalia, M (2011) ‘Prospects and Policy Challenges in the Twelfth Plan,’ Economic & Political Weekly XLVI(21): 88–105.
Aiyar, S and M Dao (2021) ‘The effectiveness of job-retention schemes: Covid-19 evidence from the German states’, IMF Working Paper WP/21/242, International Monetary Fund.
Aiyar, S and C Ebeke (2020) ‘Inequality of opportunity, inequality of income and economic growth’, World Development 136(C).
Aiyar, S and C Ebeke (2019) ‘The missing link between inequality of income and economic growth: inequality of opportunity’, VoxEU, 3 April.
Aiyar, S and A Mody (2013) ‘The Demographic Dividend: Evidence from the Indian States’, in S Shah, B Bosworth and A Panagariya (eds) India Policy Forum 2012-13 Volume 9, SAGE Publications.
Akee, R, W Copeland, G Keeler, A Angold and E Costello (2010) ‘Parents’ Incomes and Children’s Outcomes: A Quasi-Experiment Using Transfer Payments from Casino Profits,’ American Economic Journal: Applied Economics 2(1).
Auten, G and D Splinter (2023) ‘Income Inequality in the United States: Using Tax Data to Measure Long-Term Trends’, Journal of Political Economy, Forthcoming.
Balasubramanian, S, R Kumar and P Loungani (2021) ‘Inequality and locational determinants of living standards in India,’ IMF Working Paper WP/21/50, International Monetary Fund.
Besley, T and R Burgess (2004) ‘Can Labor Regulation Hinder Economic Performance? Evidence from India,’ Quarterly Journal of Economics 119(1): 91–134.
Bhagwati, J (2011) ‘Indian Reforms: Yesterday and Today,’ in PS Mehta and B Chatterjee (eds) Growth and Poverty: The Great Debate, Jaipur: Cuts International.
Bhagwati, J and S Chakravarty (1969) ‘Contributions to Indian Economic Analysis: A Survey,’ American Economic Review 59(4).
Bhalla, S (2011) ‘Inclusion and Growth in India: Some Facts, Some Conclusions,’ Working Paper 39, Asia Research Centre, London School of Economics.
Bivens, J and D Kandra (2023) CEO Pay Declined Slightly in 2022, Economic Policy Institute.
Cirillo, R (1979) The Economics of Vilfredo Pareto, Routledge, London.
Clausing, K (2020) Open: The Progressive Case for Free Trade, Immigration and Global Capital, Harvard University Press.
Darvas, Z (2019) ‘Global interpersonal inequality decline: the role of China and India,’ World Development 121: 16-32.
Dabrowski, M (2019) ‘Examining interrelation between global and national income inequalities,’ Russian Journal of Economics 4: 266-284.
Dahl, G and L Lochner (2017) ‘The Impact of Family Income on Child Achievement: Evidence from the Earned Income Tax Credit: Reply,’ American Economic Review 107(2).
Deaton, A (2023) Economics in America, Princeton University Press.
Dollar, D (2007) ‘Poverty, inequality and social disparities during China’s economic reform,’ Policy Research Working Paper 4253, World Bank.
Deininger, K and Y Liu (2013) ‘Welfare and Poverty Impacts of Mahatma Gandhi National Rural Employment Guarantee Scheme: Evidence from Andhra Pradesh, India,’ IFPRI Discussion Paper 01289, International Food Policy Research Institute.
European Commission (2007) ‘Towards Common Principles of Flexicurity: More and Better Jobs Through Flexibility and Security’, COM(2007) 359 final.
Fenton, G (2023) ‘Gains from expanded Child Tax Credit outweigh overstated employment worries,’ Center on Budget and Policy Priorities, 14 June.
Fleischer, M and D Hemel (2020) ‘The Architecture of a Basic Income,’ University of Chicago Law Review 87(1).
Fox, L and J Pacas (2018) ‘Deconstructing Poverty Rates Among the 65 and Older Population: Why Has Poverty Increased Since 2015?’ Social, Economic & Housing Statistics Division Working Paper 2018-13, US Census Bureau.
Hoynes, H, D Miller and D Simon (2015) ‘Income, the Earned Income Tax Credit, and Infant Health,’ American Economic Journal: Economic Policy 7(1).
Jainchandra, S, N Khor, R Mano, J Schauer, P Wingender and J Zhuang (2018) ‘Inequality in China: Trends, Drivers and Policy Remedies’, IMF Working Paper WP/18/127, International Monetary Fund.
Jarrow, O (2023) ‘We cut child poverty to historic lows, then let it rebound faster than ever before’, VoxEU, 21 September.
Jin, K (2023) The New China Playbook: Beyond Socialism and Capitalism, New York: Viking.
Joint Committee on Taxation (2021) ‘Estimated Budget Effects of the Revenue Provisions of Title XIII – Committee on Ways and Means, of HR 5376, The “Build Back Better Act”’, JCX-46-21, Congress of the United States.
Kanbur, R, Y Wang and X Zhang (2017) ‘The Great Chinese Inequality Turnaround’, IFPRI Working Paper 01637, International Food Policy Research Institute.
Keo, B (2020) ‘Crossing the river by feeling the stones: Deng Xiaoping in the making of modern China,’ Education About Asia 25(2).
Krueger, AB (2012) ‘The Rise and Consequences of Inequality’, speech by the Chair of the US Council of Economic Advisers.
ILO and OECD (2015) The Labour Share in G20 Economies, Report for the G20 Employment Working Group.
Lakner, C and B Milanovic (2013) ‘Global Income Distribution: From the Fall of the Berlin Wall to the Great Recession,’ Policy Research Working Paper 6719, World Bank.
Mazumder, B (2005) ‘Fortunate Sons: New Estimates of Inter-Generational Mobility in the United States Using Social Security Earnings Data’, Review of Economics and Statistics 87(2).
Milanovich, B (2022) ‘The Three Eras of Global Inequality, 1880- 2020’, Working Paper 59, Stone Center on Socio-Economic Inequality.
Narayan, S (2022) ‘Fifteen years of NREGA: Employer of last resort?’ Indian Journal of Labour Economics 65: 779-799.
Panagariya, A (2013) ‘India in the 1980s and 1990s: A triumph of reforms’, IMF Working Paper WP/04/043, International Monetary Fund.
Piketty, T and E Saez (2003) ‘Income Inequality in the United States, 1913–1998’, Quarterly Journal of Economics 118(1): 1–39.
Piketty, T, L Yang and G Zucman (2019) ‘Capital Accumulation, Private Property and Rising Inequality in China, 1978-2015’, American Economic Review 109(7): 2469-2496.
Ravallion, M (2010) ‘Poverty lines across the world’, Policy Research Working Paper 5284, World Bank.
Suphaphiphat, N and Y Shi (2022) ‘Economic scarring: channels and policy implications’, IMF Working Paper WP/22/248, International Monetary Fund.
Pursell, G (1992) ‘Trade Policies in India’, in D. Salvatore (ed) National Trade Policies, Greenwood Press.
Rawls, J (1971) A Theory of Justice, Harvard University Press.
Topalova, P (2007) ‘Factor immobility and regional impacts of trade liberalization: Evidence on poverty from India’, American Economic Journal: Applied Economics 2(4).
Wolf, M (2023) The Crisis of Democratic Capitalism, Penguin Press.
Yagan, D (2019) ‘Employment Hysteresis from the Great Recession’, Journal of Political Economy, 127(5).
Zhuang, J and S Li (2016) ‘Understanding Recent Trends in Income Inequality in the People’s Republic of China’, ADB Economics Working Paper Series 489, Asian Development Bank.
Zhang, X, J Yang and S Wang (2011) ‘China Has Reached the Lewis Turning Point’, China Economic Review 22(4): 542–554.
This article is based on an essay in the Bruegel Essay and Lecture Series.