An assessment of IRA climate measures
Simon Voigts and Anne-Charlotte Paret are Economists at the International Monetary Fund
There is a wide gap between most countries’ greenhouse gas (GHG) mitigation pledges and actual policy implementation, putting the global economy widely off track to honour the 2015 Paris Agreement (UN Environment Program 2023). The Inflation Reduction Act (IRA), signed into law by President Biden on 16 August 2022, aims to significantly narrow that implementation gap in the US, in addition to pursuing other objectives.
In a recent paper (Paret and Voigts 2024) we apply the IMF’s new Global Macroeconomic Model for the Energy Transition model (GMMET, see Carton et al 2023) to assess the impact of those IRA measures that are related to climate and energy security, focusing on both GHG emissions and the macroeconomy up to 2030.
While the IRA has been discussed extensively (including on Vox, see for example Fajeau et al 2023 and Attinasi et al 2023), we contribute to the literature by employing a model that captures key measures in a granular fashion, by assessing complementary policies to bridge the remaining gap to the US’ medium-term climate pledge, and by shedding light on the dynamic implications of a permitting reform.
GMMET builds on the IMF’s Global Integrated Monetary and Fiscal model (GIMF), which is a large-scale, non-linear, structural, multi-country New Keynesian dynamic general equilibrium model for quantitative monetary and fiscal policy analysis. GMMET adds a granular, sector-specific modelling of key GHG-emitting sectors that allow to capture sectoral idiosyncrasies playing a crucial role for emission mitigation.
These sectors include: (i) an electricity generation sector with different technologies (renewables, coal, gas, nuclear) and explicit treatment of intermittent generation from renewables; (ii) a transportation sector with conventional cars, electric vehicles (EVs) and a charging station network (giving rise to network effects); and (iii) fossil fuel-specific mining sectors.
Due to GMMET’s sectoral granularity, most key measures have a direct representation in the model, so that their uptake is determined endogenously. To proxy for the IRA’s tax on profits made by large corporations and the excise tax on stock buybacks and exemptions, the measures are assumed to be funded by corporate income taxes, implemented as a tax on the profit from the ownership of firms.
The following measures are modelled:
Electricity sector measures: The Clean Electricity Production Tax Credit (PTC) is represented by a 33% subsidy on the model’s renewable utility’s total production cost, while the New Advanced Manufacturing Production Tax Credit is a 40% subsidy on the price of capital good employed by the utility. The Nuclear Power Production Tax Credit raises nuclear power investment such that capacity increases by roughly 15%.
Transport sector measures: The Clean Vehicle Credit is a gradually increasing subsidy on EV purchases reaching 15% by 2030 (proxying for a slow increase in the share of manufacturers fulfilling domestic content requirements). The Alternative Fuel Refueling Property Credit exogenously increases the charging network density by 13.4%, based on an estimate of the charger station supply elasticity in Cole et al (2023). Both measures have a direct model representation, as the choice between both car type and the charging station network are explicitly modelled to capture network externalities.
Other measures: The Carbon Capture and Sequestration Tax Credit and measures related to agriculture and waste exogenously reduce the tradable goods emission intensity. The various measures aimed at improving residential energy efficiency improve productivity on the bundle of natural gas and oil that is used by households for home heating. This allows to capture the general equilibrium impact of reduced fuel demand. Spending for all three measures is captured as government spending.
The social value of the induced emission cuts outweighs their fiscal costs
The impact of the IRA
Selected key results emerge from our analysis and are presented in the following. Absent permitting-related investment delays, IRA climate measures deliver large emission reductions at manageable fiscal costs and with an expansionary but very small impact on the overall economy:
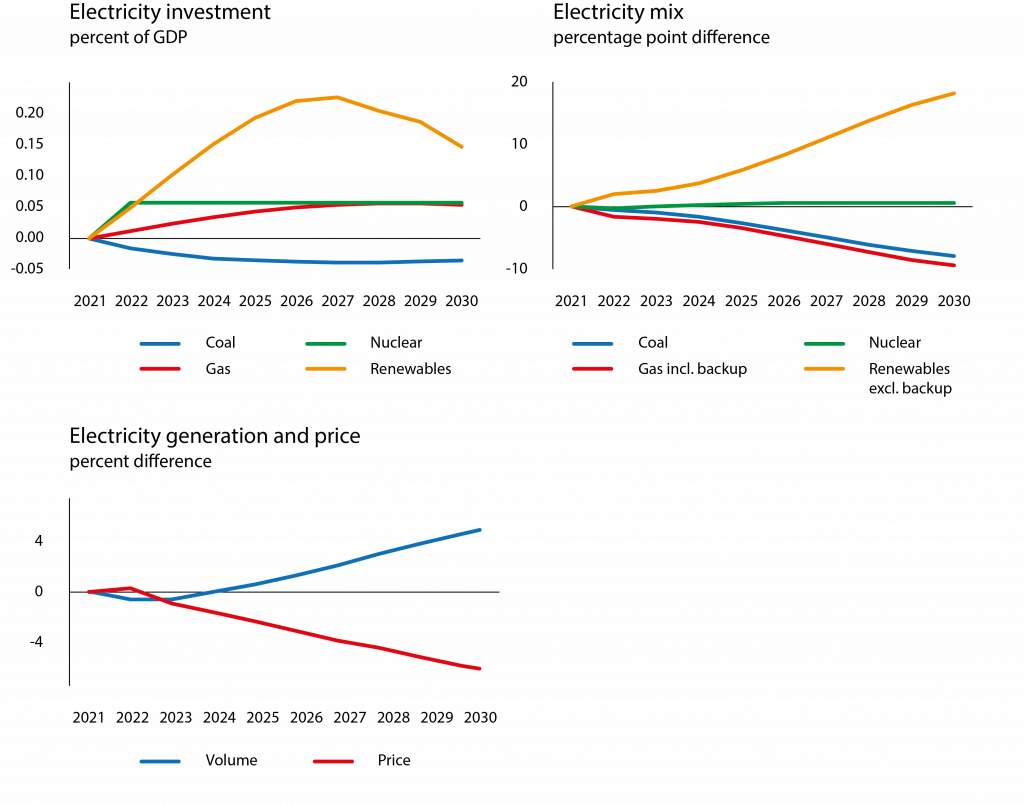
-The share of renewables in the electricity mix rises by around 19 percentage points by 2030, at the expense of gas and coal. The Clean Electricity Production Tax Credit and the New Advanced Manufacturing Production Tax Credit lower the renewable utility’s overall generation costs and, respectively, the price of capital. As shown in Figure 1, this triggers a surge in renewable investment and reduces investment in coal utilities via crowding out. Gas investment ticks up slightly due to its role as a back-up for renewables, and investment in nuclear power rises mildly from the Nuclear Power Production Tax Credit. The subsidies boost the total volume of electricity generation and thereby reduce the electricity price.
Figure 1.
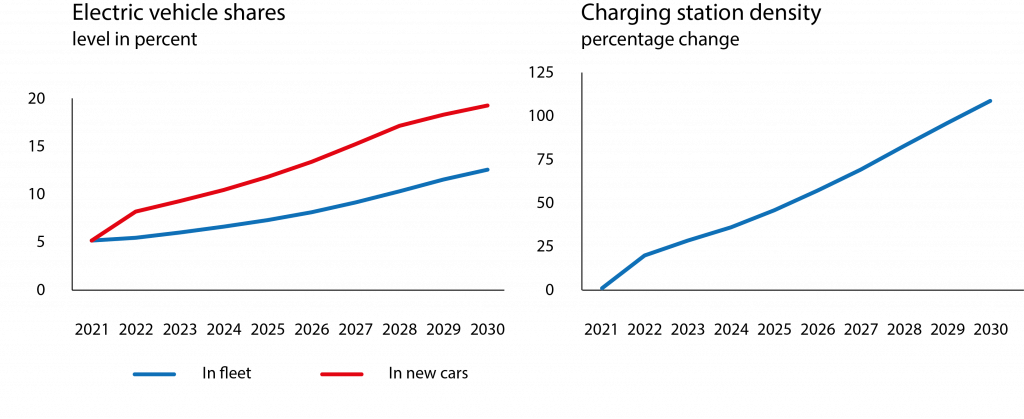
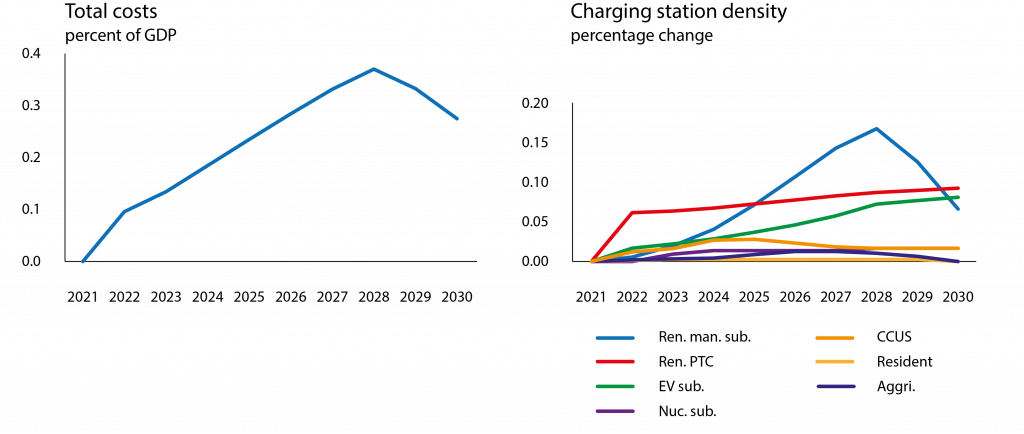
-The share of EVs in newly purchased cars increases by slightly less than 5 percentage points upon introduction of the Clean Vehicle Credit in 2022, and thereafter rises gradually to reach 19% by 2030. The charging station density increases when the Alternative Fuel Refueling Property Credit is adopted, and then rises gradually until it more than doubles by 2030. EV adoption and charger deployment reinforce another in a virtuous circle driven by network externalities, where a denser charging network incentivises EV adoption, while a rising EV share incentivises charger deployment.
Figure 2.
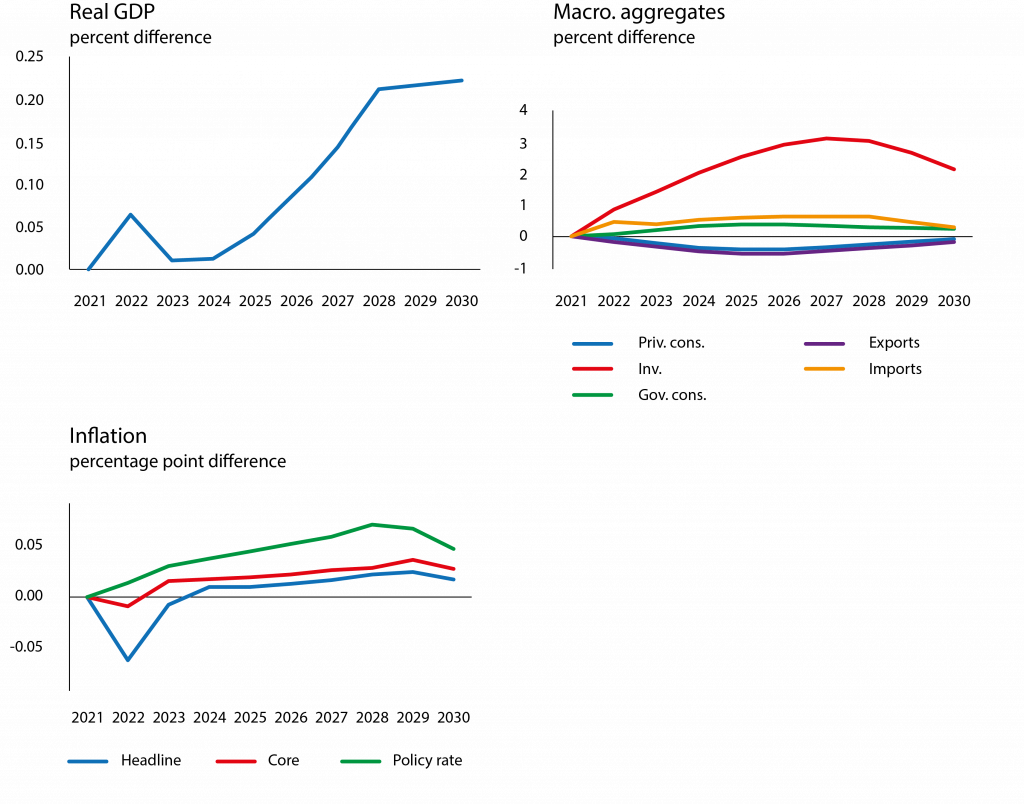
-The impact on the macroeconomy is expansionary but very modest in size. Aggregate investment rises, reflecting investments in the electricity and manufacturing sectors. The latter is driven by lower electricity prices as energy and capital are assumed to be complements. This complementarity, combined with the non-distortionary source of funding, provide the key explanation for the mild increase in output of close to 0.25% by the end of the decade. The remaining aggregates exhibit a milder response, and the impact on inflation and the policy rate are negligible. The main explanation for the muted macroeconomic impact is that the electricity sector, where the IRA has the largest effect, is small. While the depicted impact is obtained from a simulation with lump-sum funding of the measures, the results under corporate income financing are virtually identical; the only noticeable difference is that output rises by roughly half as much (given the small magnitude of the adjustment, it is almost identical in absolute terms), owing to the additional tax-induced distortions. The takeaway is that, even when the funding side is modelled appropriately, climate-related IRA measures have a vanishingly small impact on output and inflation.
Figure 3.
-Total fiscal costs are estimated to be in the same order of magnitude as in the 2023 update by the CBO/JCT (CFRB, 2023). They rise over time as subsidy take-up increases (especially for capital goods employed by the renewables utility), and peak at about 0.4% GDP towards the end of the decade, when renewables investment comes down as the capital stock has grown. Applying these cost shares to nominal GDP projections from the October 2023 World Economic Outlook, and cumulating through 2030, yields undiscounted total costs of about $700 billion. Together with IRA climate-measures that are not modelled (and whose emission impact is therefore not captured) total costs stand at $820 billion. This is well above the initial CBO/JCT estimate of about $350 billion over this period (CBO, 2022), but only moderately above the $590 billion by 2030 estimated in the 2023 update of JCT scores, and relatively close to some other recent estimates (eg. Fajeau et al 2023).
Figure 4.
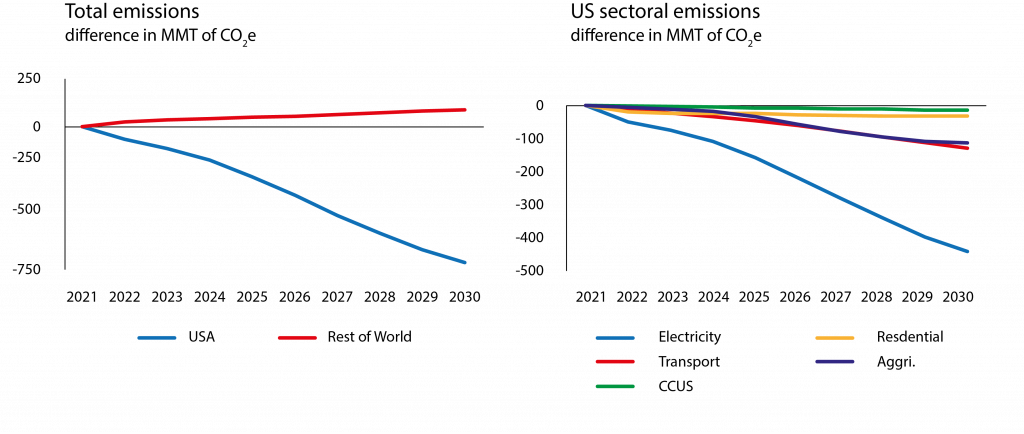
-Total annual emissions decline by about 710 MMT by 2030, mostly driven by electricity generation, followed by the transport sector and agricultural measures. Assuming a no-policy emission reduction of 27% between 2005 and 2030, IRA measures bridges slightly less than half of the way to the mitigation target of a 50-52 percent reduction over this period. Emissions in the rest of the world increase by about 100 MMT. With weaker demand from the US, fossil fuel prices decline on global markets, causing an uptick in foreign consumption.
Figure 5.
The social value of the induced emission cuts outweighs their fiscal costs.
While GMMET does not feature warming damages, and therefore does not allow for a cost-benefit analysis, we still provide an indication that the IRA’s climate measures carry a social value greater than their fiscal cost. To approximate the measures’ desirability, we compare the fiscal costs per ton of GHG reduction from our simulation with a plausible estimate of the social costs of carbon (SCC), $185 per tonne, taken from Rennert et al (2022).
The ratio of cumulative fiscal costs over cumulative emission reductions – a metric for average fiscal abatement costs – stands at about $400/tCO2 in 2022, but then declines swiftly to reach the SCC of $185/tCO2 in 2029 and settles at $50/tCO2 in the long run (the decline results from subsidy-induced investments yielding long-term emission reduction benefits). This suggests that by the end of the decade, the social value of IRA emission reductions greatly outweighs their fiscal cost, making the measures highly desirable from a cost-benefit viewpoint.
Reducing permitting-related delays in energy investment is crucial to unlock the measures’ full potential.
The National Environmental Policy Act of 1970 requires federal permit for infrastructure projects, including for energy, and this permitting process takes around 4.5 years on average (eg. American Clean Power Association 2023). This is captured by an adjustment in electricity investment rigidity.
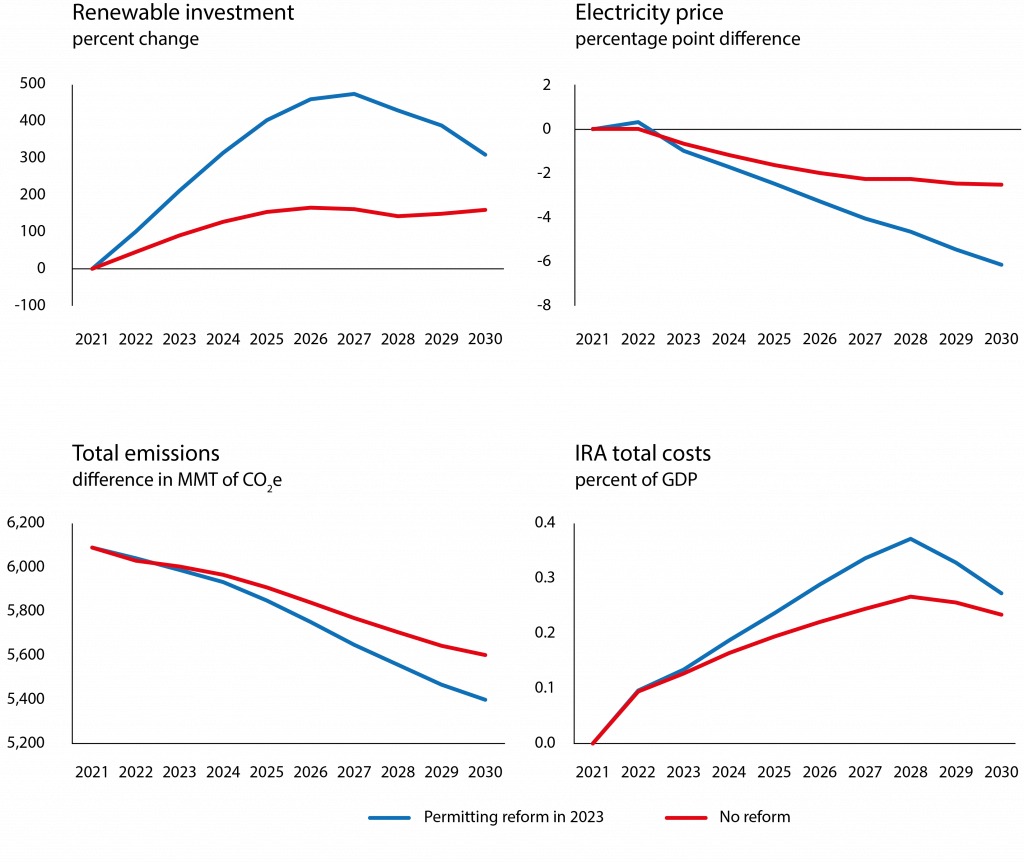
If permitting delays remain in place (ie. if permitting processes are not shortened, in contrast to the previous simulation), the investment surge in renewable generation is attenuated, delaying the addition of new generation capacity and with it the decline in the electricity price.
Emissions drop by only two-thirds of the amount in the absence of permitting delays, and the dampened take-up of renewable subsidies cuts fiscal costs, while the implications for the adjustment of output and inflation are negligible in absolute terms.
Figure 6.
Additional policies
In our paper, we also consider two hypothetical measures that could complement the IRA to substantially reduce the mitigation policy implementation gap. The measures target areas of low-cost emission abatement that are not addressed to a significant extent by the IRA:
-A regulatory measure (introduced as a feebate-like tax) that reduces the coal share in the electricity mix by about one percentage point each year. This would tap into room for low-cost abatement resulting from 15% post-IRA coal share in 2030 (lacking targeted measures, IRA only curbs electricity generation from coal via crowding-out).
-A regulatory measure leading oil and gas industries to abate about three-quarters of today’s methane emissions. The associated costs are modelled as a decline in the productivity in GMMET’s oil and gas mining sectors, calibrated based on abatement costs estimates. Emissions from these industries have recently been estimated to be vast, at nearly 400 MMT of CO2e, while about 300 MMT could be abated at minimal costs (IEA, 2023). However, observed emission cuts have been negligible relative to their potential. The effectiveness of IRA provisions aimed at curbing methane emissions is likely to be minor, as legislative details (including reporting thresholds and emission aggregation rules) limit the scope of emissions that are covered (Mahajan et al 2022 expect 2030 emissions to decline by only 29 MMT).
When the IRA climate measures are complemented by the two regulatory measures, the drop in coal power plant investment becomes stronger, which amplifies the rise in renewables and gas investment. Regarding electricity generation volume and price, the disinvestment from coal triggered by the regulation works in the opposite direction from IRA subsidies, boosting renewable generation capacity.
Initially, the decline in coal generation dominates, but the IRA-induced surge in capacity more than offsets this from 2026 onwards, leading to a rise in the electricity volume (and a decline in the price) by the end of the decade. In the short term, the regulatory measures slightly reduce output and push up inflation, but the overall picture is virtually unchanged. This is not surprising given that methane abatement comes at minimal cost and that the coal regulation lowers its electricity share very gradually.
However, the complementary regulatory measures greatly reduce emissions, which would drop by a total of about 1,300 MMT by 2030, nearly covering the remaining gap to the emission reduction target.
References
American Clean Power Association (2023), “U.S. Permitting Delays Hold Back Economy, Cost Jobs”.
Attinasi, MG, L Boeckelmann and B Meunier (2023), “Unfriendly friends: Trade and relocation effects of the US Inflation Reduction Act”, VoxEU.org, 3 July.
Carton, B, C Evans, DV Muir, and S Voigts (2023), “Getting to Know GMMET: The Global Macroeconomic Model for the Energy Transition”, IMF Working Paper No. WP/23/269.
Cole C, M Droste, C Knittel, S Li and JH Stock (2023), “Policies for Electrifying the Light-Duty Vehicle Fleet in the United States”, AEA Papers and Proceedings 113.
CRFB – Committee for a Responsible Federal Budget (2023), “IRA Energy Provisions Could Cost Two-Thirds More Than Originally Estimated”.
Fajeau, M, N Garnadt, V Grimm et al (2023), “The US Inflation Reduction Act: How the EU is affected and how it should react”, VoxEU.org, 17 October.
International Energy Agency (2023), Methane Tracker Database, IEA, Paris.
Mahajan, M, O Ashmoore, J Rissman, R Orvis and A Gopal (2022), “Updated Inflation Reduction Act Modelling Using The Energy Policy Simulator”, Energy Innovation, Policy and Technology LLC.
Paret, A-C and S Voigts (2024), “Emissions Reduction, Fiscal Costs, and Macro Effects: A Model-based Assessment of IRA Climate Measures and Complementary Policies”, IMF Working Paper No. WP/24/24.
Rennert, K, F Errickson, BC Prest et al (2022) “Comprehensive evidence implies a higher social cost of CO2”, Nature 610(7933): 687-692.
United Nations Environment Programme (2023), Emissions Gap Report 2023: The Closing Window.
Authors’ note: The views expressed are those of the authors and do not necessarily reflect those of the International Monetary Fund. This article was originally published on VoxEU.org.


